


Living Inside a Broken Clock: Tuesday, Dec. 29, 2009.
Living Inside a Broken Clock: Tuesday, Dec. 29, 2009.
by gmak
By the pricking of my thumbs, something wicked this way comes. It is the end of the year. Most people are hibernating for a week or two. Our financial and political uberclass are rearranging the fiddles on the burning titanic.
http://online.wsj.com/article/SB126168307200704747.html?mod=WSJ_newsreel_us
And China is determined to help the Banksters keep the party going.
http://finance.yahoo.com/news/China-shares-up-on-premiers-apf-785025415.html?x=0&.v=1
There has been over a year of unending and unprecedented stimulus. Governments have tried to pull forward as much future consumption as is insanely possible. Yet the global economy continues to wind down. International capital flows are drying up as the shadow banking system continues to fade away:
http://blogs.cfr.org/setser/2008/12/29/the-collapse-of-financial-globalization/
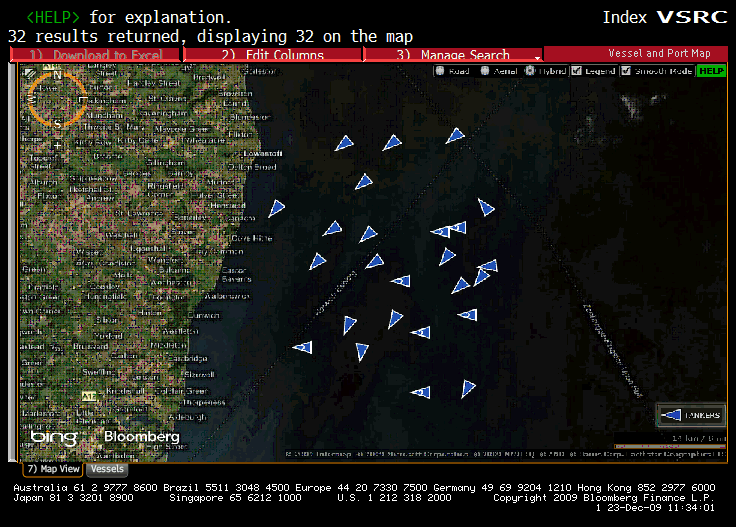
Economic growth is illusory. There are enough idle tankers off the coast of the UK to form a line 26 miles long and block the Channel. This scene is being repeated around the world. Hardly the stuff that booms are made of.
The cracks are growing in Europe.
http://suddendebt.blogspot.com/2009/12/euros-trojan-horse.html
http://eurowatch.blogspot.com/2009/12/quantifying-eurozone-imbalances-and.html
US Cities are being faced with the reality of having to live within their means.
We’ve all seen the chart of the wave of re-fis coming up that matches those storm waves that Centrifugal likes to ride.
http://www.nolanchart.com/article/print.php?ArticleID=7157
http://www.the-peoples-forum.com/cgi-bin/readart.cgi?ArtNum=2765
We also have seen articles on all the difficulties in resolving mortgage issues due to the complex structures and ownership overlayed on the instruments. Here is a chart of Mortgage /GDP from a number of countries.
http://www.banknoise.com/wp-content/uploads/2009/09/mortgage-gdp-ratio.png
All of this has yet to happen to CRE. Office space vacancies have not yet peaked based on the last recession.
There are still $205 bb in tbills (based on Bloomberg table of auctions) and tnotes that settle on Dec 31 and were /are being auctioned this week, even though the regular buyers have been absent for some time.
http://jessescrossroadscafe.blogspot.com/2009/12/who-is-buying-all-these-us-treasuries.html
This becomes a problem given the 10 fold increase in NET borrowing expected in 2010 in the US. There are only 3 options: 1) More QE; 2) Much higher rates; and, 3) Risk market (equity) crash to push money towards “risk-free” fixed income. $1 trillion in new debt means $1 trillion in new money needed to “invest” in that debt. This is nigh impossible.
The bailout caps on Fannie and Freddie have been eliminated. Maybe they will be used for money creation to soak up the Treasury debt.
Table S-9 shows that your out of control politicians are going to squander all of your hard-earned money (and I use the term loosely – money that is). Go back up to the “regular buyers have been absent for some time”. Rinse and Repeat.
http://www.whitehouse.gov/omb/assets/fy2010_new_era/Summary_Tables2.pdf
To top it off, the bond vigilantes are taking the final nail from lips to coffin.
http://www.reuters.com/article/idUSTRE5BP0EF20091226
I am sad to say, here is your country’s future. It’s no longer “Cake or death?” anymore, it’s just “Death or death” (economicl). Welcome to the broken clock.
http://globaleconomicanalysis.blogspot.com/2009/12/michigan-forces-business-owners-into.html
http://jessescrossroadscafe.blogspot.com/2009/12/what-will-new-world-reserve-currency.html
EQUITY
THe world is green except for the Middle East & Africa, Hong Kong, and S. Korea. The DAX continues to march upwards and is above the magical 6000 number. Expect more of the same for SPX. The daily SPX chart shows that slow march up towards the purple dashed line that should mark the point of retrace – or no return. The arcs are FIB arcs drawn with the center point at the March low of 666. Notice that nothing major has happened on any of the visible ones. Similar to the Heisenberg uncertainty principle, TA will tell you where or when – but not both. There is just too much going on above, plus the New Year, to believe that January will see a break out. I’m expecting a retrace. I just don’t know from which level. In any case, no retrace will be a fundamental change in direction unless it gets below the 1086 level (green dashed line) and somehow manages to clear both the TD risk level (red dashed line) and the last low – SPX needs to start putting in lower hghs and lower lows. So far we have neither. I would be happy with a lower low.

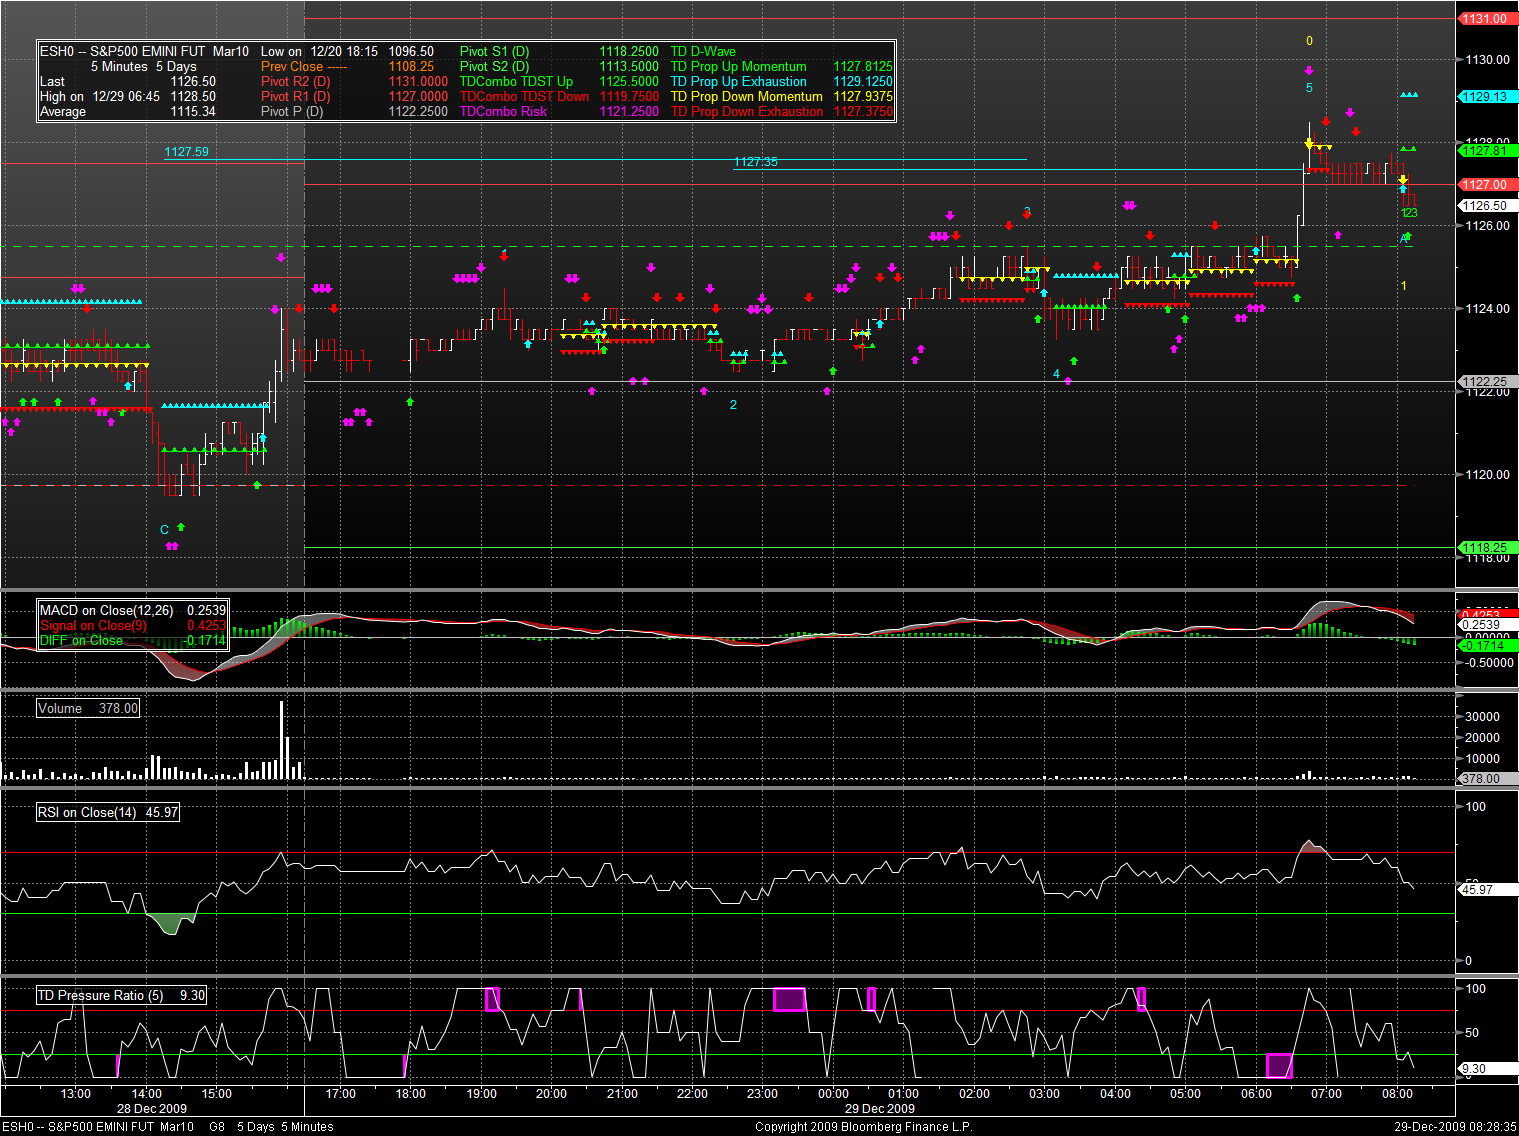
If someone can explain what is with ES from about 6:30 on, I would be a happy man. Did someone suddenly realize that they hadn’t closed out a short position? ES pivots:
- R2: 1131 =Doesn’ tseem to have any historical significance. Looks like TD was predicting this level for wave 3 of 5 (up sequence) in the current move. Note that we are in wave 5 on the daily chart.
- R1: 1127 = This is where TD says the current wave on the 5 minute chart is supposed to turn around.
- Neutral: 1122.25 = Suport and resistance level going badck to Dec 24.
- S1: 1118.25 = Handily below the TD risk level at 1120. If we get here on any volume, it looks like a short term reversal is happening. This would put in a lower low on the 5 min chart.
- S2: 1113.50 = This was support on Dec 23 that helped launch the latest drive up. Not likely to see this before January.
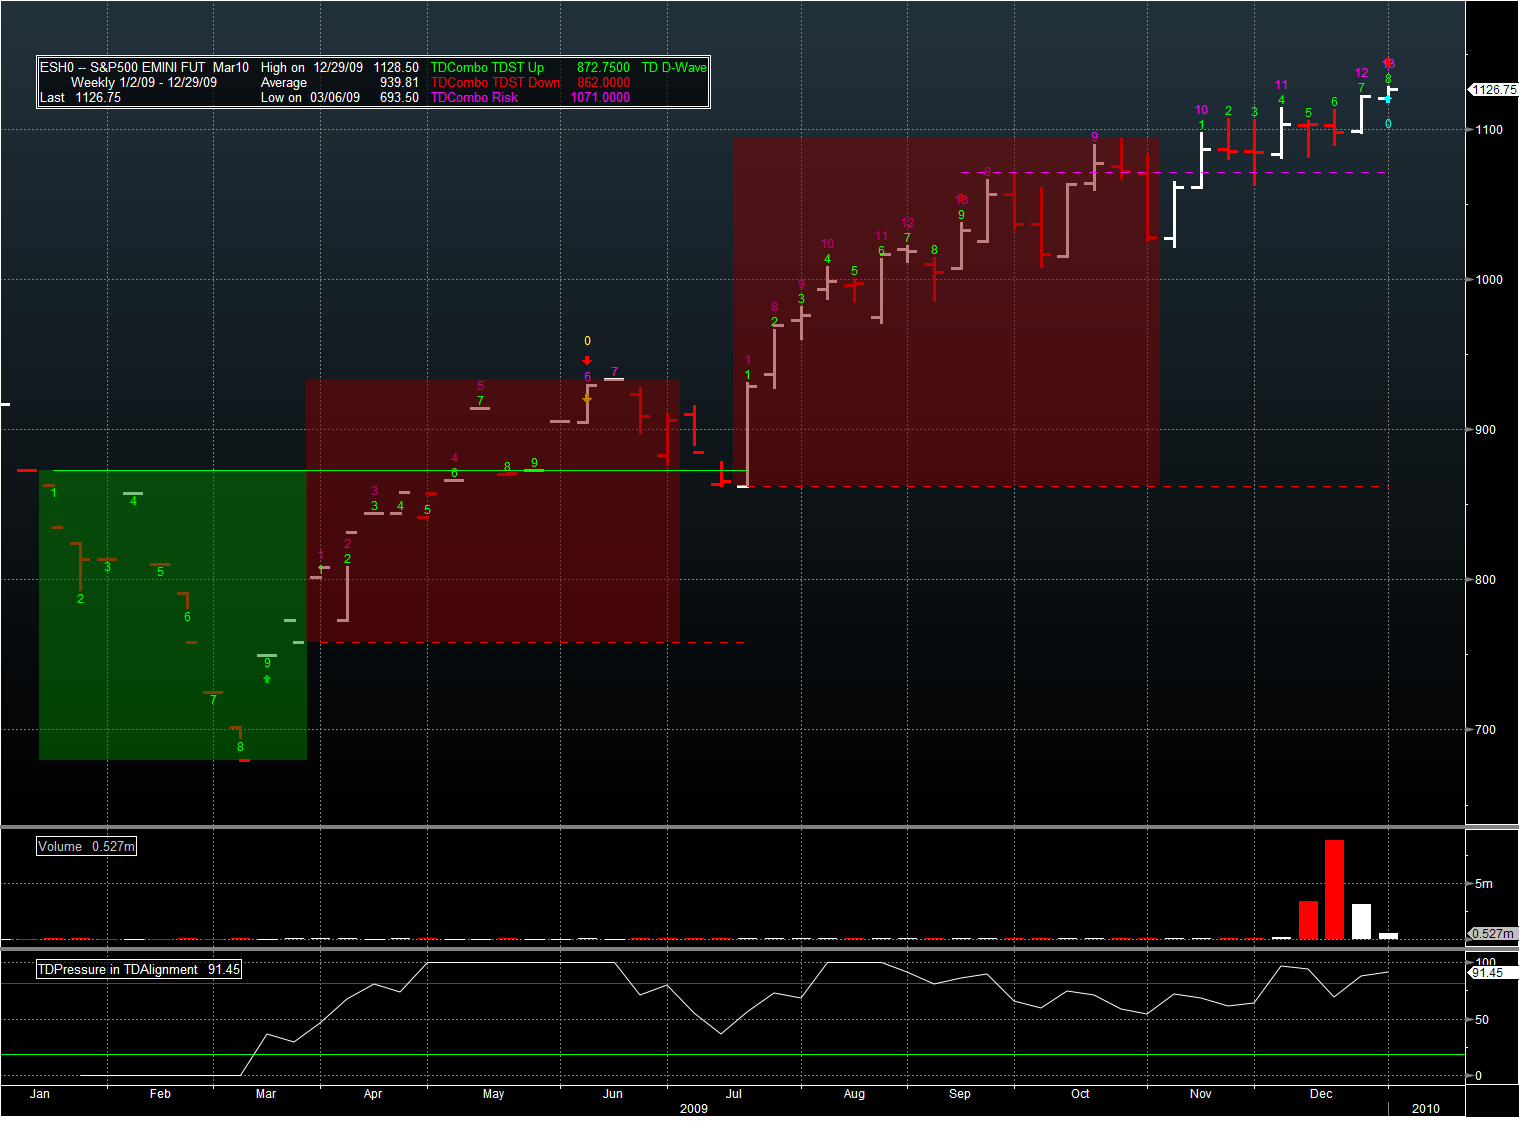
As you may have seen in the comments section yesterday, on a weekly basis, ES is putting in bar 8 of 9 in a SELL setup sequence (TD TA). Plus, this week is bar 13 of a SELL countdown (which significes buyer exhaustion). Given how the TD TA looks, next week should be bar 9 of the SELL setup, followed by a reflex retrace of 1 to 4 bars. The TD Pressure indicator at the bottom of the chart seems to be pointing in this direction as well with the overbought condition (above the red line). Moving below the red line – which should not happen this week – would signal a low risk SELL. The purple dashed line is a TD Risk level at 1071 and indicates a support level. ES would have to go below, then retest from below for the down trend to continue – if ES ever gets there (we know it will, just not when).
FX
USD is weaker. CAD, EUR, are stronger. GBP is flat, JPY is slightly weaker. Looks like the risk trade but in slow motion / low volume. I have a pivot at DXY = 77.36 on the 30 min chart that is also a strong support level from earlier in the month. If it lets go – on volume mind you – then I can see 76.50ish and below in short order (we’re talking over days, not minutes). Given the action into year end, I wouldn’t bet the farm on any FX /Equity correlations that have worked this year. Nothing is for certain until volume comes back in January, IMHO.
Treasury auctions are big news, IMHO. Watch the TNX.
I’m on Bloomberg Anywhere, and it has trouble saving screens to file, so I don’t have the news and data screens for you. Home prices are up at 9 AM EST. Consumer confidence is at 10AM EST. Jobless claims are on the last day of the year (Thursday).
CONCLUSION
http://globaleconomicanalysis.blogspot.com/2009/12/most-redeeming-feature-of-capitalism-is.html
“Any healthy system needs a way to correct error and remove waste. Nature has extinction, the economy has loss, bankruptcy, liquidation. Interfering in this process lengthens feedback loops. Error and waste are allowed to accumulate, and you ultimately get a massive collapse.”
- This can only end in tears;
- This can only end in tears;
- A few more bears will have to be crushed before the momentum shifts; and,
- This can only end in tears.
I predict higher interest rates. I predict lower equity prices. I predict many many versions of “Who could have foreseen”. I just don’t know when.
Cheers.


