


Running between the Rain Drops by gmak
Running between the Rain Drops by gmak
Living Inside a Broken Clock
China inflation and industriasl production have accelerated more than expected. It’s becoming more and more obvious (in the fairy tale .gov data world, anyway) that the taps need to be turned off. The USA budget deficit has hit a record and a 17 month drive to the abyss. Meanwhile, interest paid on that debt has been shrinking. How tight can you wind a clock’s spring before it explodes?
Europe wants to ban Naked CDS trading – you can read all about this evil in many, many posts over the last 2 years at Market Ticker. There is doubt that this will succeed without Obama support – and it is very warm and cozy in the banker’s vest pocket.
The strikes resume in Greece, and some prognosticators believe that the country will miss their already-low GDP target. Yet the world’s watchmen keep turning that key and the spring is getting more and more tightly coiled -and not in a good way 😛
Get the popcorn ready, because Greenspan is scheduled to testify before the Financial Crisis Inquiry Commission in April.
Tick. Tock. Sproing!
EQUITY
Gatopeich is taking the analysis I’m doing and is running with it. The guy never sleeps. Check out his comment on the previous post.
My own analysis says that yesterday was a ’15’ and the SPX slope was positive. The highest probability for today’s bar shape is: ’72’ which means open at the HOD and close down near the LOD. The next highest probability is open near the LOD and close near the HOD. Now, wasn’t that helpful? I don’t think so either. BUT, the first half hour might indicate what sort of day it will be – and if it looks like range trading, then the bar is likely to be a decent size.
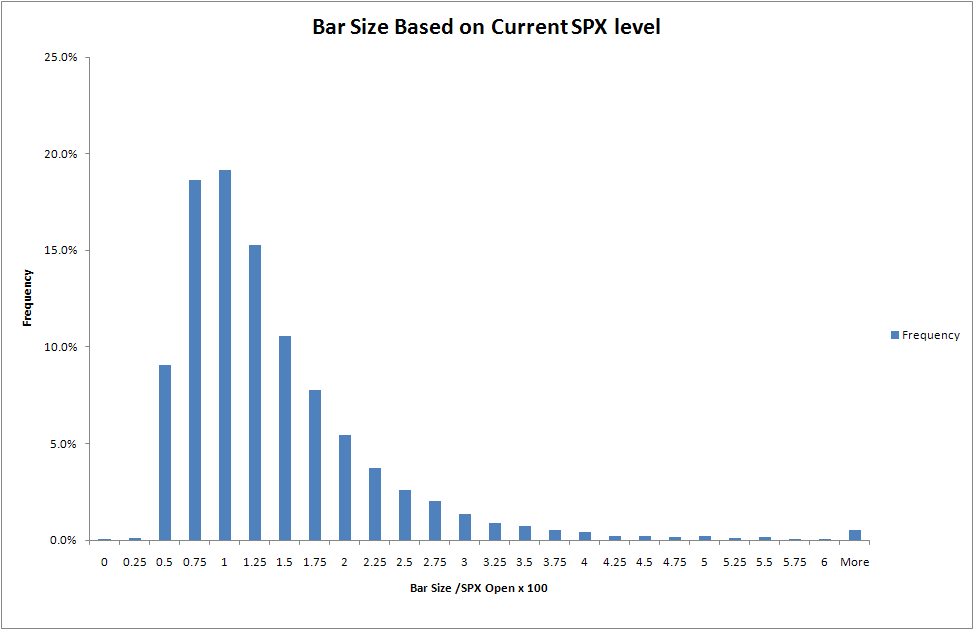
This is based on data since April 1982. If I take that percentage and apply it against 1140 (a typical value for SPX), I get the following bar size distribution for our current environment.
| Frequency | BAR SIZE |
| 0.0% | 0 |
| 0.1% | 2.85 |
| 9.0% | 5.7 |
| 18.6% | 8.55 |
| 19.2% | 11.4 |
| 15.3% | 14.25 |
| 10.6% | 17.1 |
| 7.8% | 19.95 |
| 5.5% | 22.8 |
| 3.7% | 25.65 |
| 2.6% | 28.5 |
| 2.0% | 31.35 |
| 1.4% | 34.2 |
| 0.9% | 37.05 |
| 0.7% | 39.9 |
| 0.5% | 42.75 |
| 0.4% | 45.6 |
| 0.2% | 48.45 |
| 0.2% | 51.3 |
| 0.2% | 54.15 |
| 0.2% | 57 |
| 0.1% | 59.85 |
| 0.1% | 62.7 |
| 0.0% | 65.55 |
| 0.0% | 68.4 |
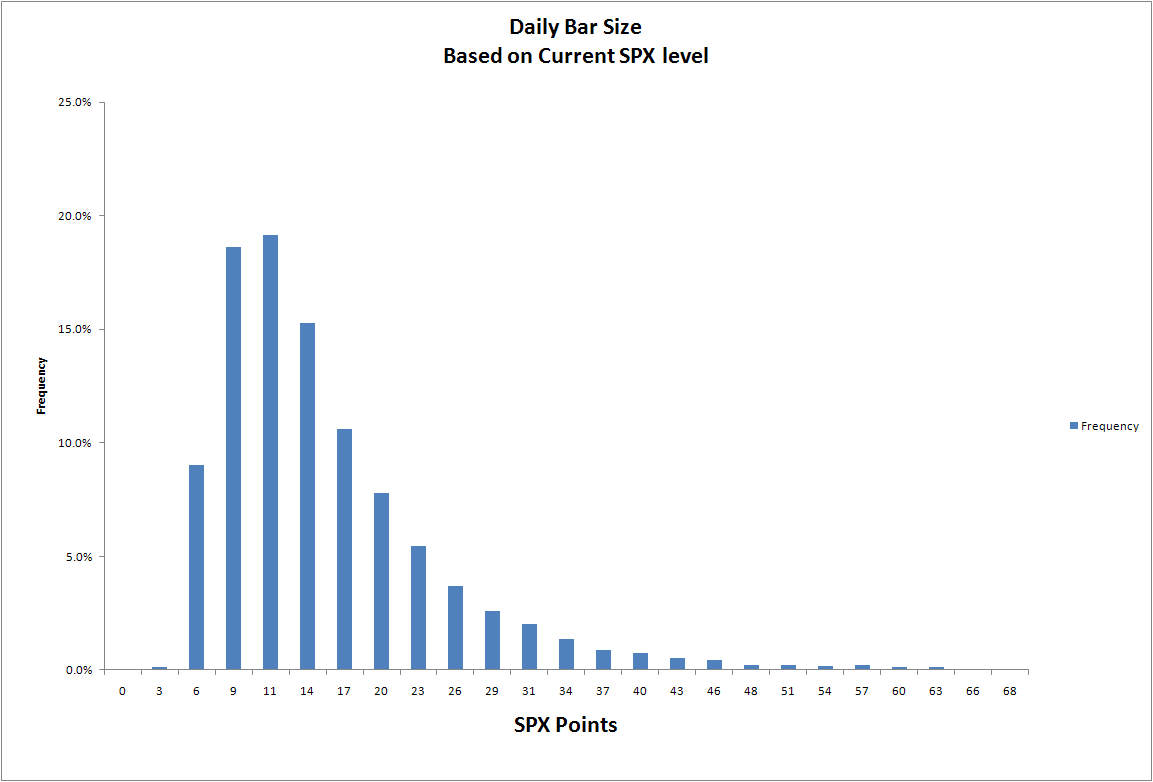
That says that there is a high probability of the High – Low being between 6 and 23. (each ‘bin’ is from the label number to the next one. i.e. ‘6’ means between 6 and 9). That’s a pretty decent size for intra-day trading given that the majority of bars open near the LOD or HOD and close near the other end.
I played EUR long overnight and put on a short ES hedge this morning. The market took me out of the EUR, but I’m still short ES. I have put a stop on now that the “hedge” is off.
Asia was mixed iwth Emerging in the red along with Oz, Taiwan, and S.Korea. Everything else was green – but not by much (japan was up 0.8%). Europe is red, except for Germany, Iceland, and Ireland. Germany is pretty close to flat. Breadth for the red is between 60 – 80% if compnaies down.
The DAX recovered off of a dip at the open. 50/50 on the green / red sectors. Those in the green are strongly so. Those in the red – the breadth is evenly divided. This looks like a market that wants to go higher – but is either afraid to (or is seeing distribution into the demand).
The ES sold off as Asia fully opened and the China news came out, but has formed what looks like a failed cup and handle – the handle failed to launch (sorry Matthew and Jessica but this smells better than that movie). Pivots:
- R2: 1154 = same deal as yesterday. Looks like a little TA wishful thinking to see the Jan high get taken out. Today is jobless claims and trade balance. I don’t think that this is rocket-launch news. Maybe if some new liquidity program is announced – but with the implications of China needing to cool off…..
- R1: 1150 = Same deal as R2. The mood is not euphoric. There is some fear. What would you feel if your hand was in a buried candly jar and you couldn’t let go of the loot? What if something was coming up behind to whack you and you still couldn’t let go to escape? Welcome to the IB world right now.
- Neutral: 1144 = This is the current level of resistance that was support before the Asia-induced sell off at 8 – 10 PM EST last night.
- S1: 1140 = This provided support in the small sell off. It would likely do so again on dips. Overnight, though, does not give an indication of the degree of support. BUT, this level has been both support and resistance over the last few days.
- S2: 1133.75 = This was the area of support before the ramp on Tuesday that began at 8AMish (post-data?).
DATA
8:30 AM = Trade balance (IF this has shrunk then be aware that it gives FCBs less USD to put into treasuries and shows strengthening pressure on the USD)
Jobless claims = Pinocchio would be proud. 460K expected vs 469K prior. How can they be that precise? It’s easy when you have a birth /death model.
Noon = Feds Flow of Funds. This should be good for the doom and gloom crowd.
Stay nimble. Did you know that the ’24’ , ’15’ bars of the last two days has only occured once before, since April 1982? I wonder if it means anything….


