


AAPL Long Term Statistics
AAPL Long Term Statistics
Over the past few days I have been making a lot of progress on my statistical charts project. Today’s milestone was to hook in a python routine to extract data from Yahoo instead of IQFeed, as adjusted daily data is more than sufficient for calculating long term statistics – plus of course it is free. The end goal is to integrate the code into a simple web page with a symbol query field on top that accepts all Yahoo finance symbols. If that works as planned then it would be available around the clock to all my subscribers.
Of course there is still a bit of legwork ahead as I not only will have to set up Django (a python server) but also integrate whatever form I get to work with the rest of the site. So give me a few more weeks but I will keep plugging on this. In the interim I plan on occasionally posting a few stats right here on various symbols of interest. So if you have any particular symbols you are interested in then please make sure to make yourselves heard in the comment section. Yes, the Mole is taking special requests, but don’t over do it! 😉
Today’s turn is AAPL – for no particular reason and simply because it was my symbol for testing integration of the Yahoo module.
Monthly Stats:
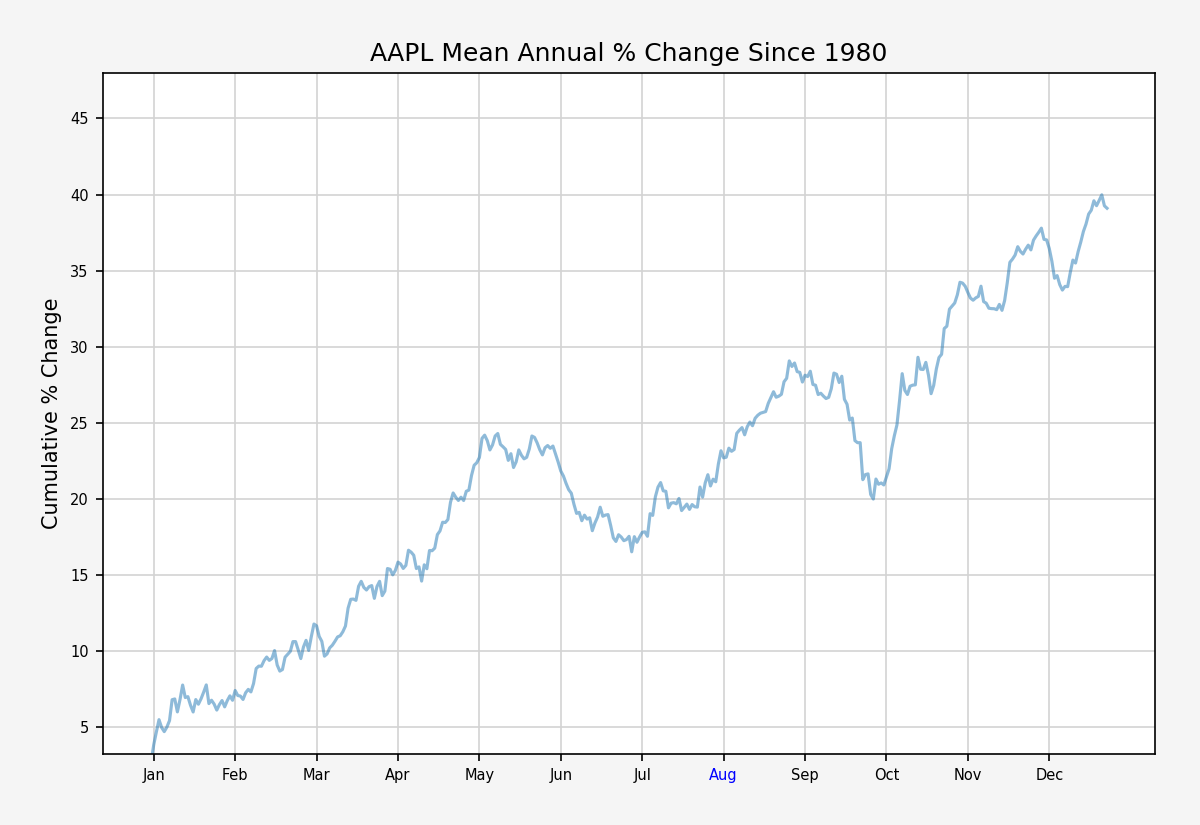
Cumulative performance shows pretty pronounced in June and September. Good to know if you’re holding AAPL today.
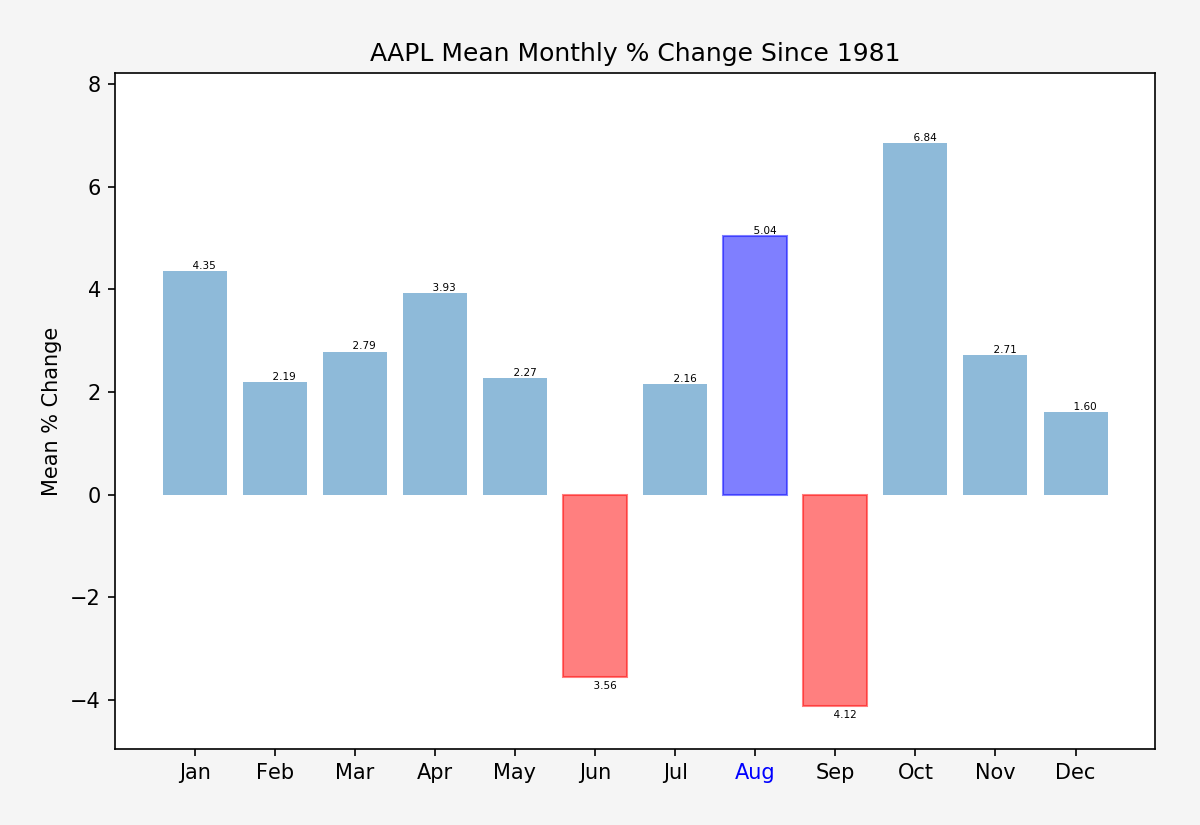
Monthly returns in percent terms. June and September clearly suck for Apple.
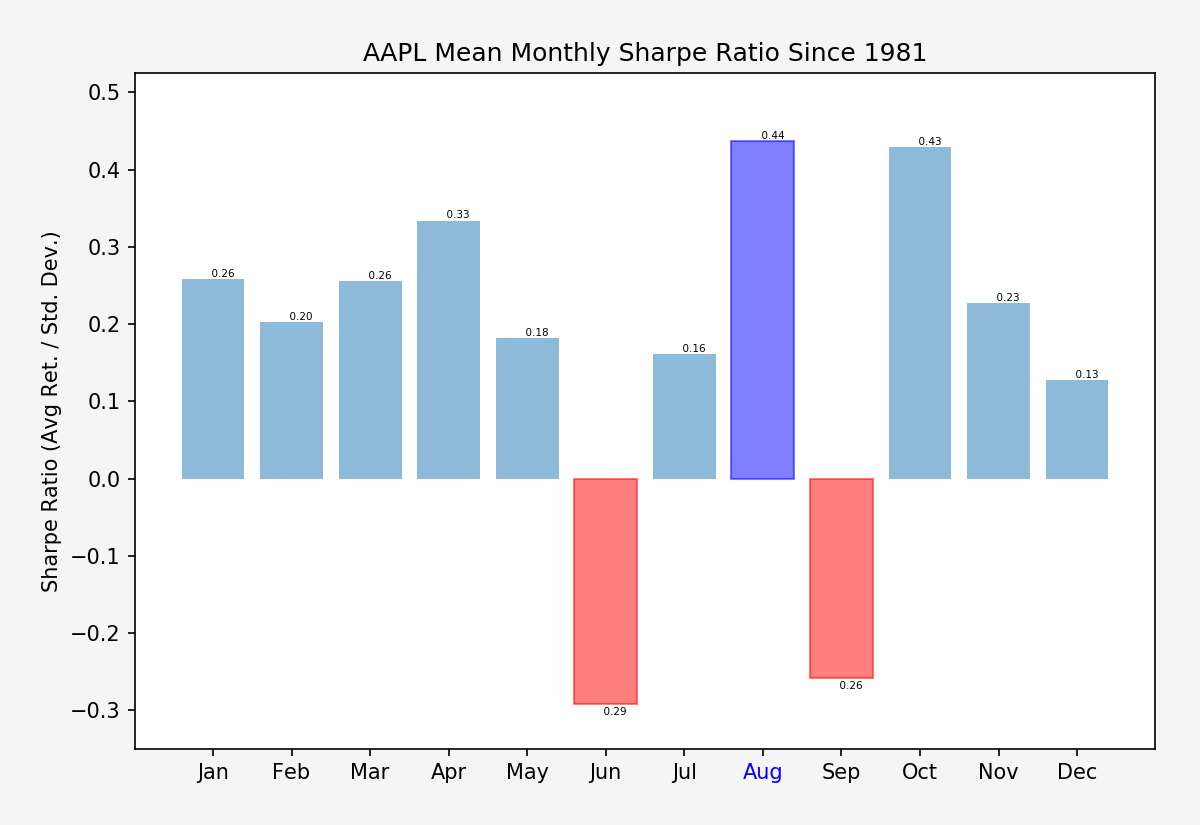
The same but measured in monthly Sharpe ratio.

Monthly SKEW. Interestingly that October seems to be slightly negatively shifted despite being a high performing month. Apparently we have a few negative outliers in October.
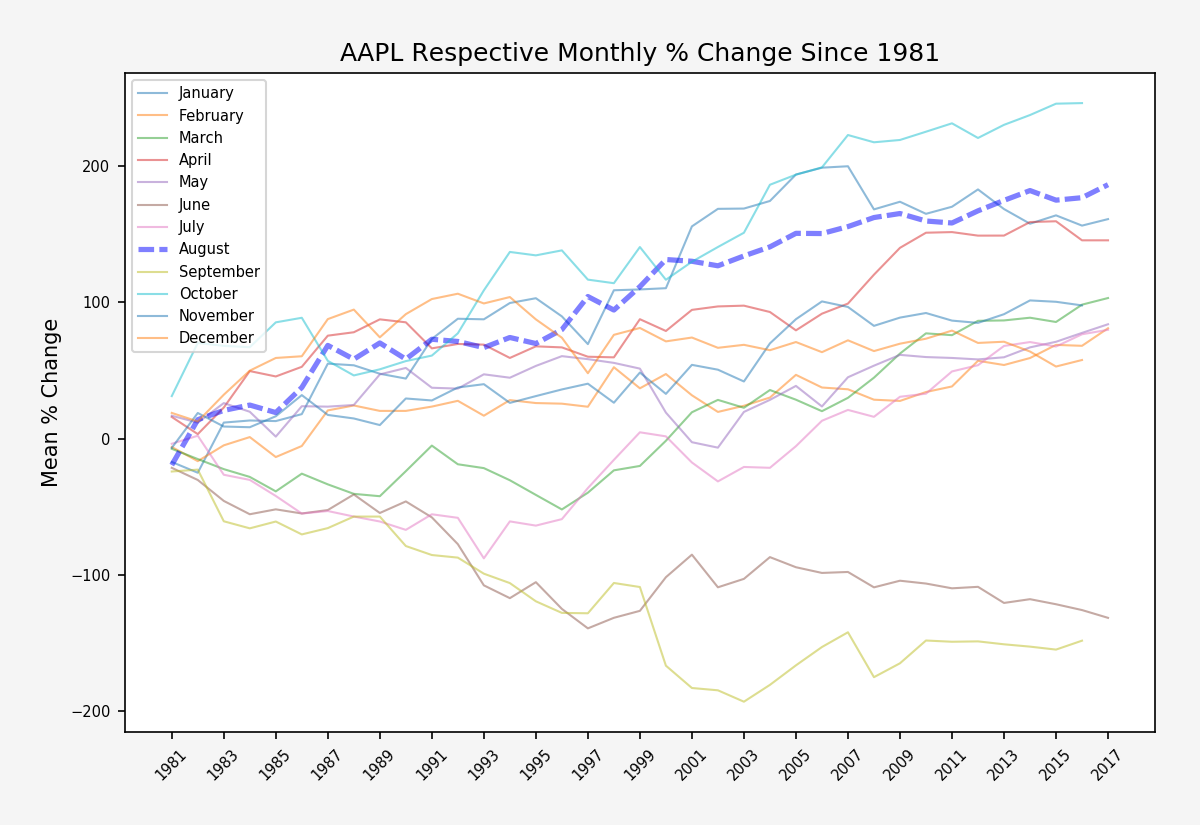
Respective monthly performance. I love this chart and who of you would have guessed that August is one of the best performing months for AAPL?
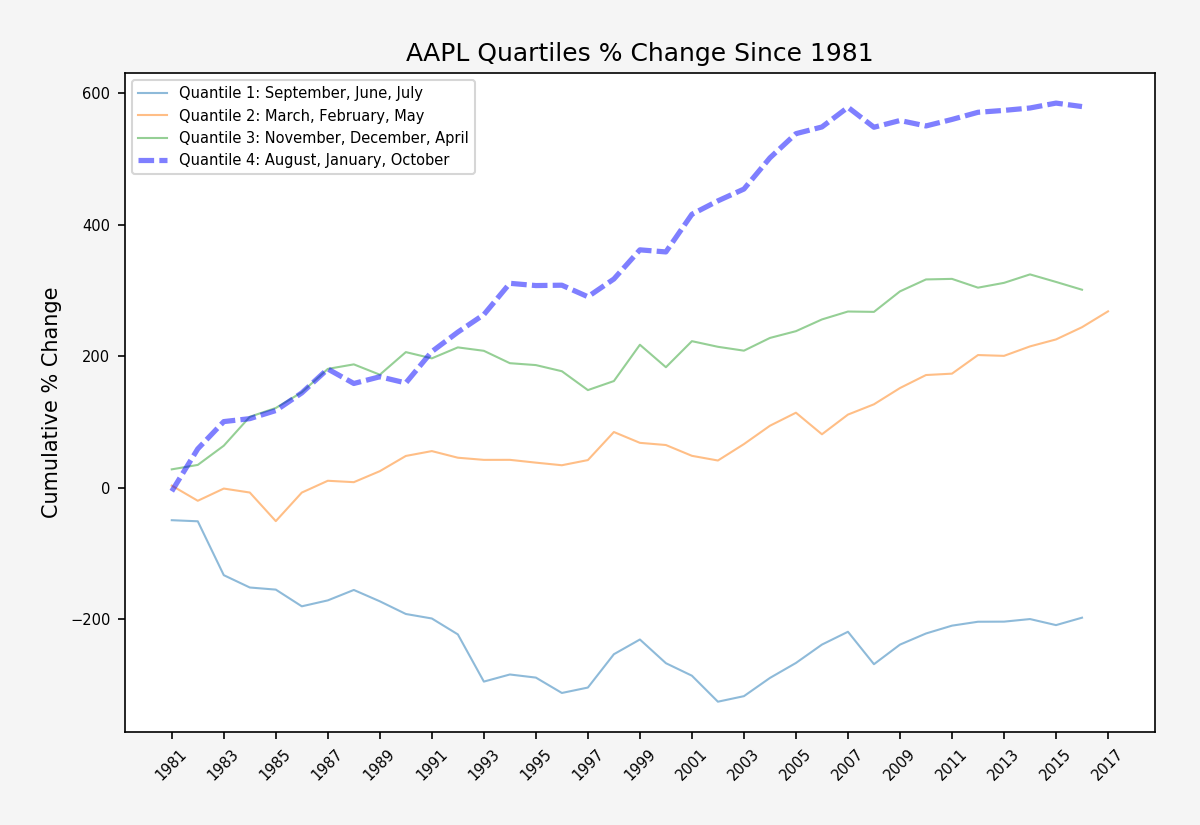
Quantiles:
- Crap: September, June, July
- Sideways: March February, May
- Good: November, December, April
- Best: August!!?, January, October
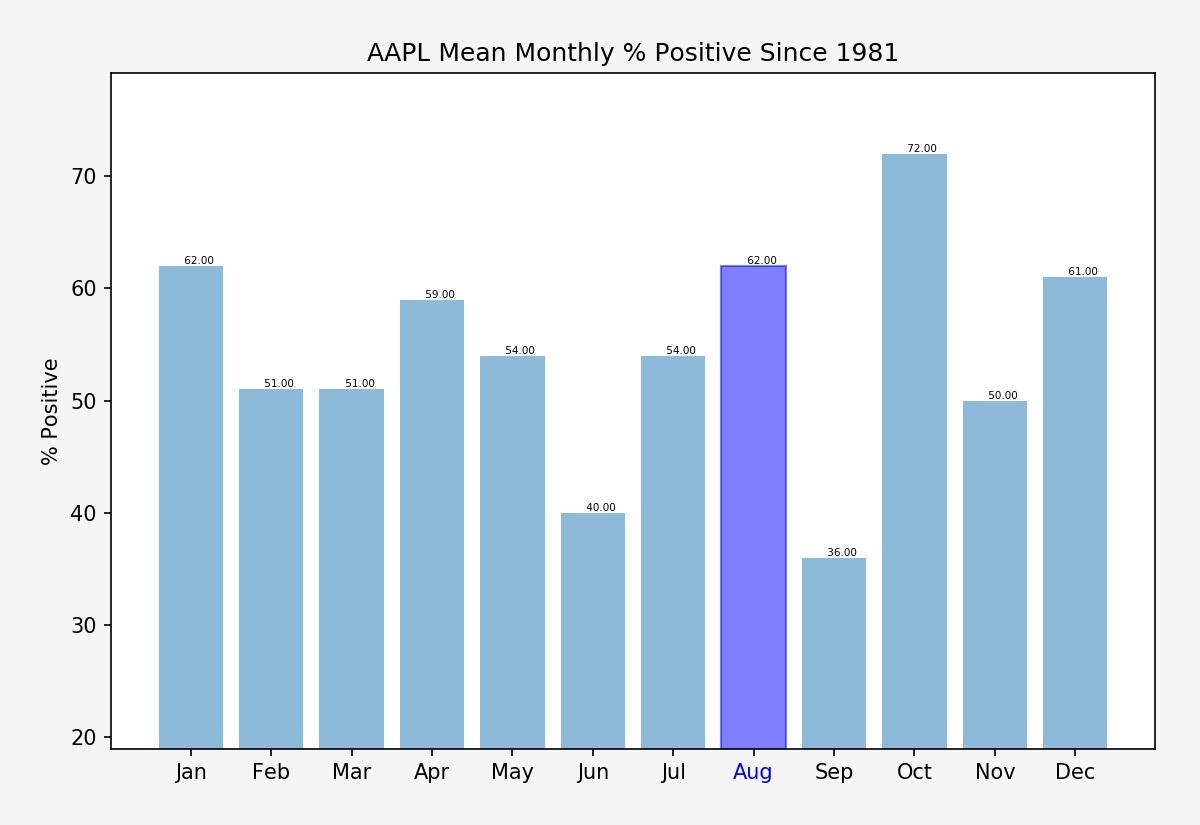
Percent Positive – very interesting and once again September stands out here as a hands-down loser.

Monthly trading ranges of AAPL. Clearly September and October are by far the most volatile.
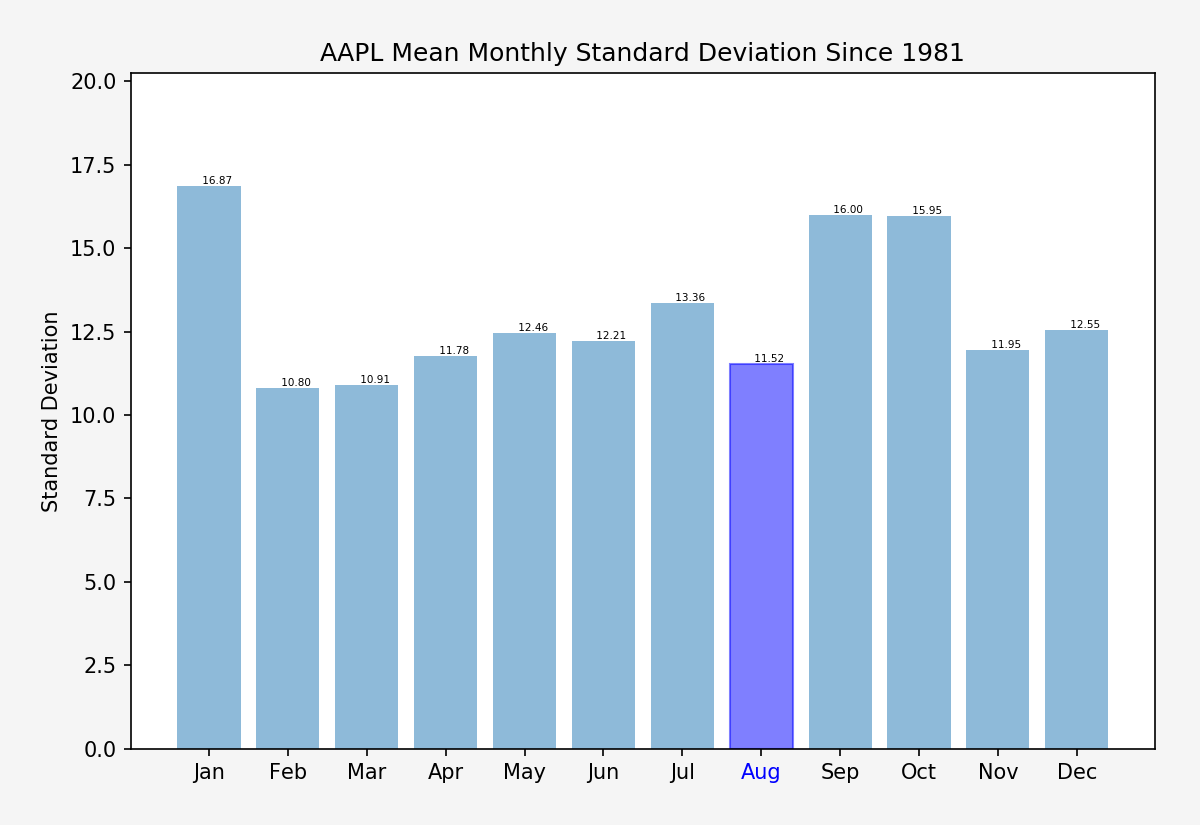
Standard Deviation: January seems to be not only the one of the best performing but also most trending months.
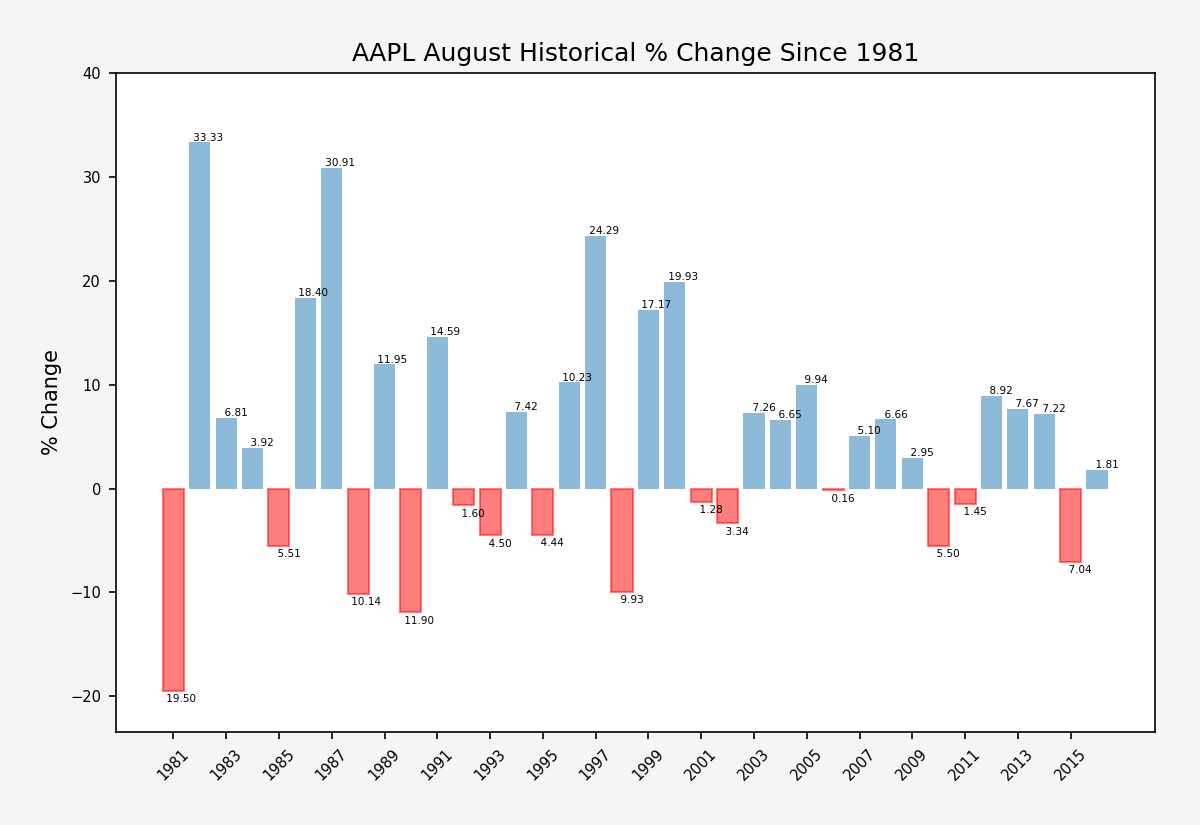
Here is the historical performance for the month of August only. I know it’s almost over but I didn’t have time to hack the code to spit out next month. Anyway, note how August performance seems to be leveling off since 2000.

And here’s the histogram of all August returns. Historically a great month for AAPL – note how the 0 mark is shifted over quite a bit.
Weekly Stats:
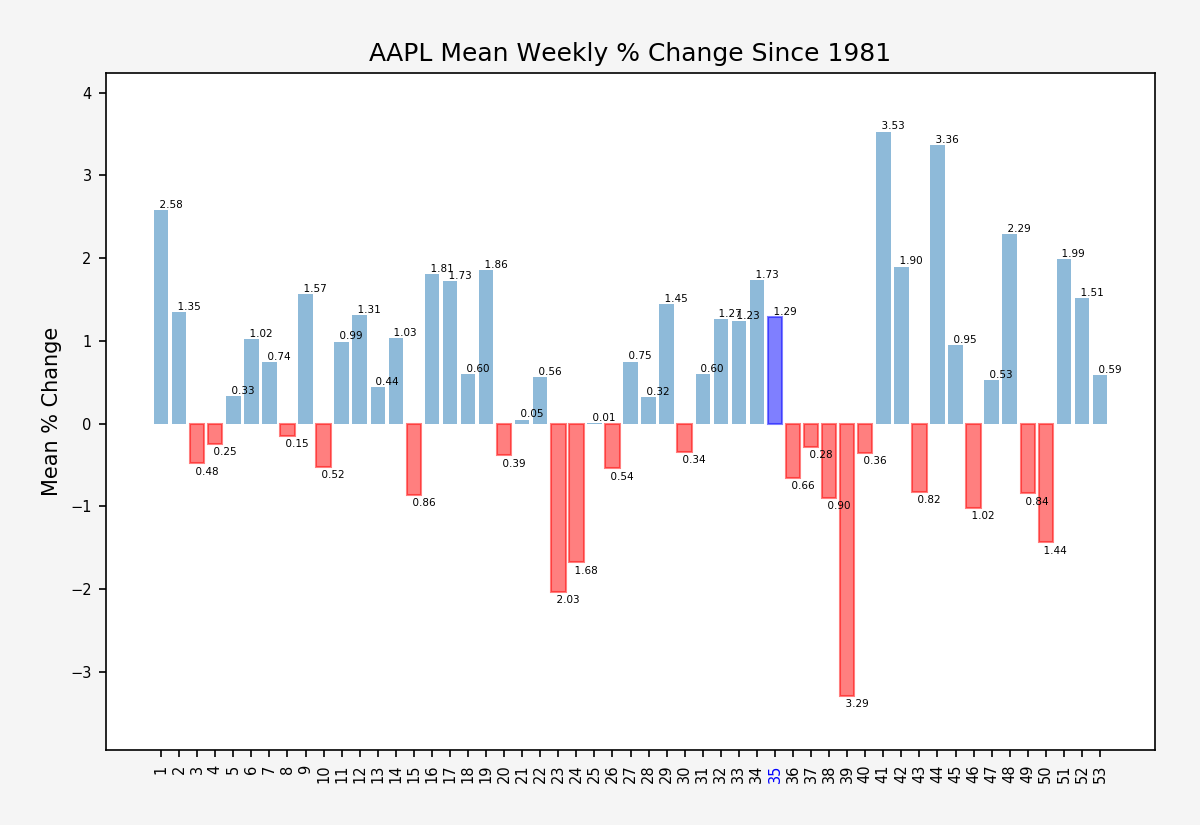
Weekly performance in percentage terms. Boy oh boy – September really does suck for AAPL.
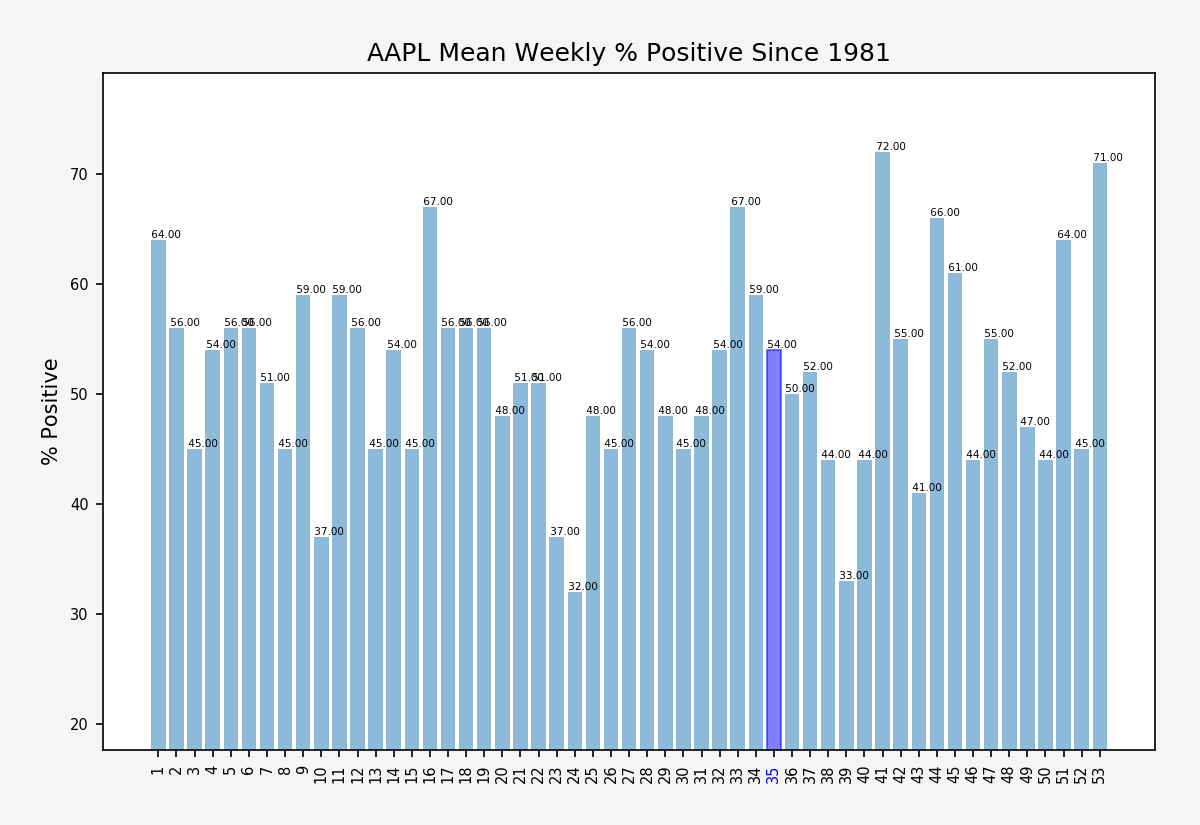
Weeks which by percent positive. The end of the year (Christmas shopping season) clearly is the highest performing season.
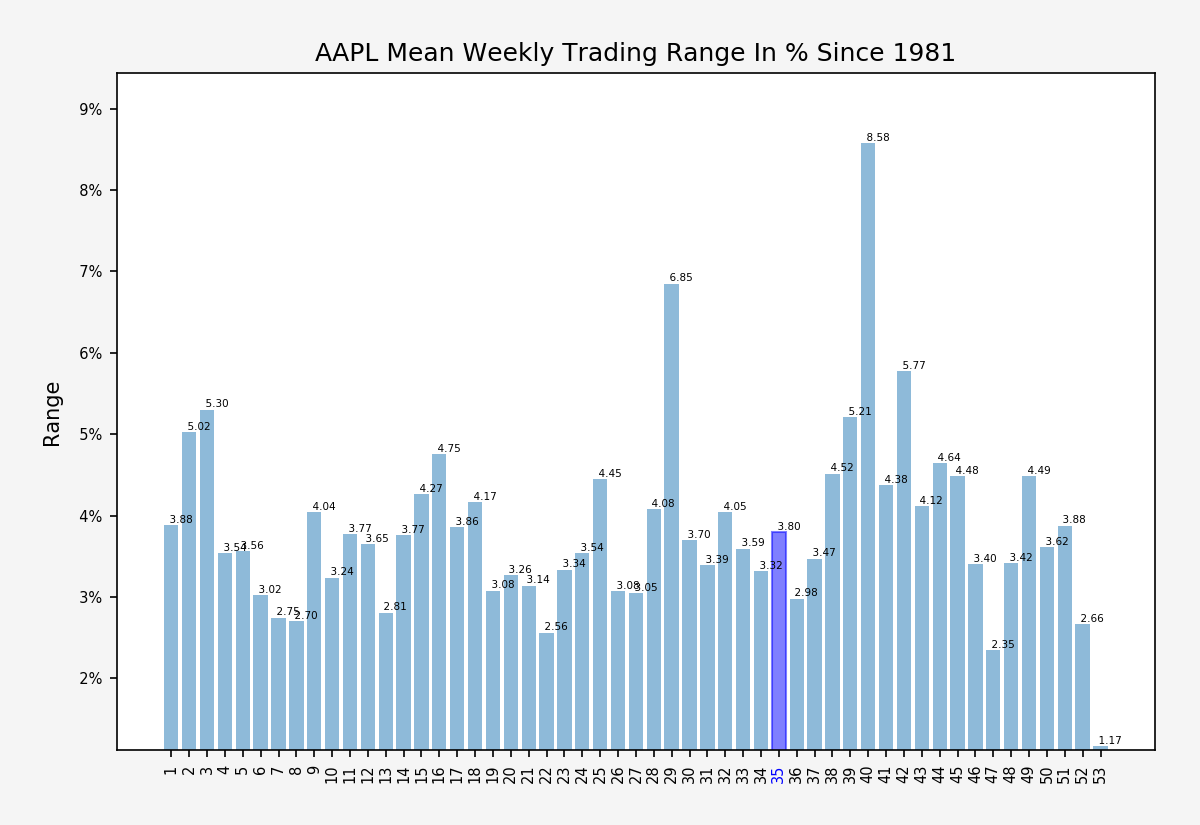
Trading Ranges per week. If you’re holding AAPL after mid September then strap on our helmets!
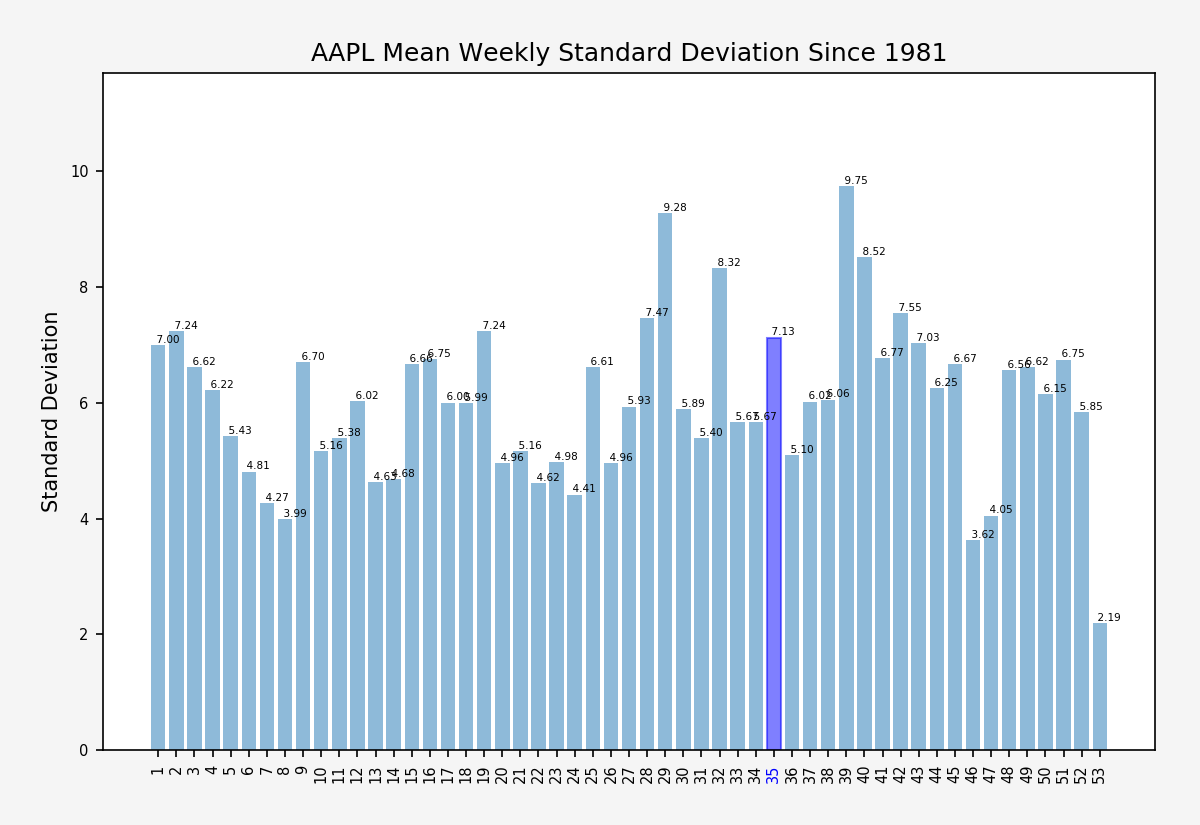
Standard deviation – that’s in percentage terms which I probably should point out on the chart.
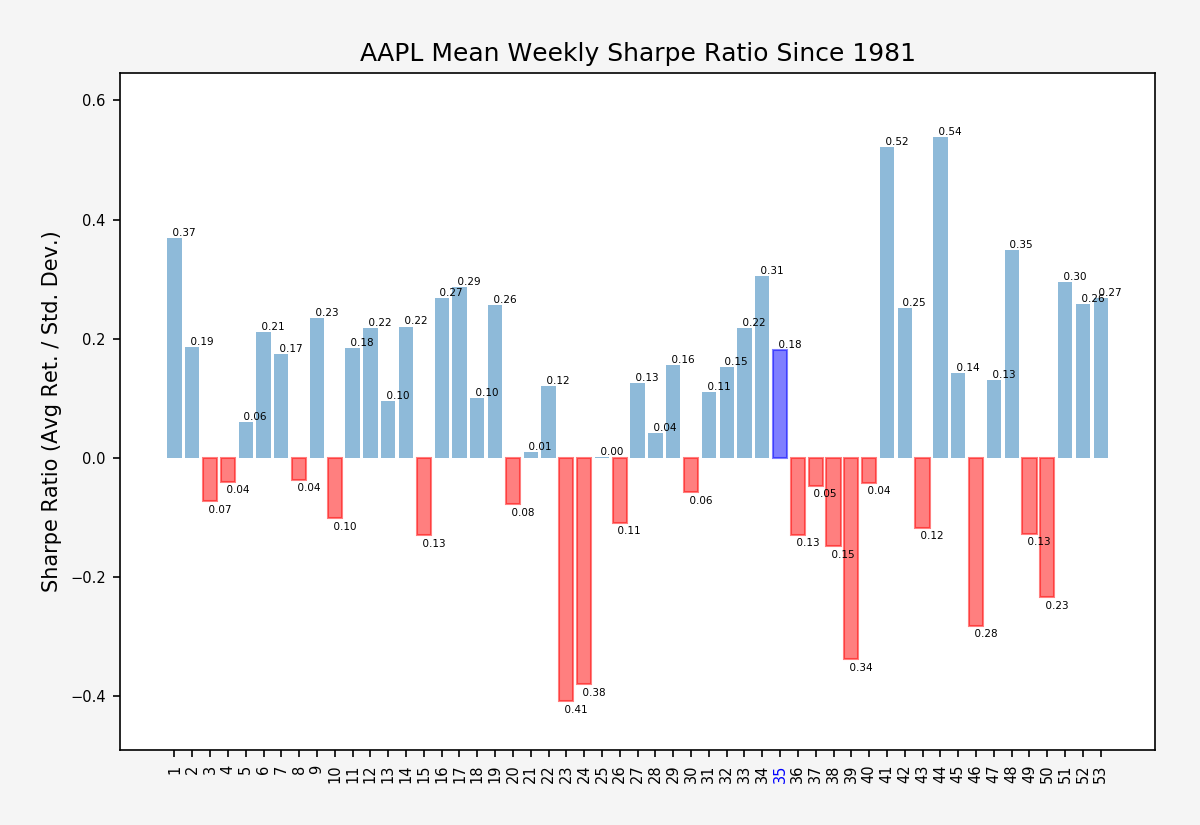
Sharpe Ratio – which again is the mean divided by standard deviation.
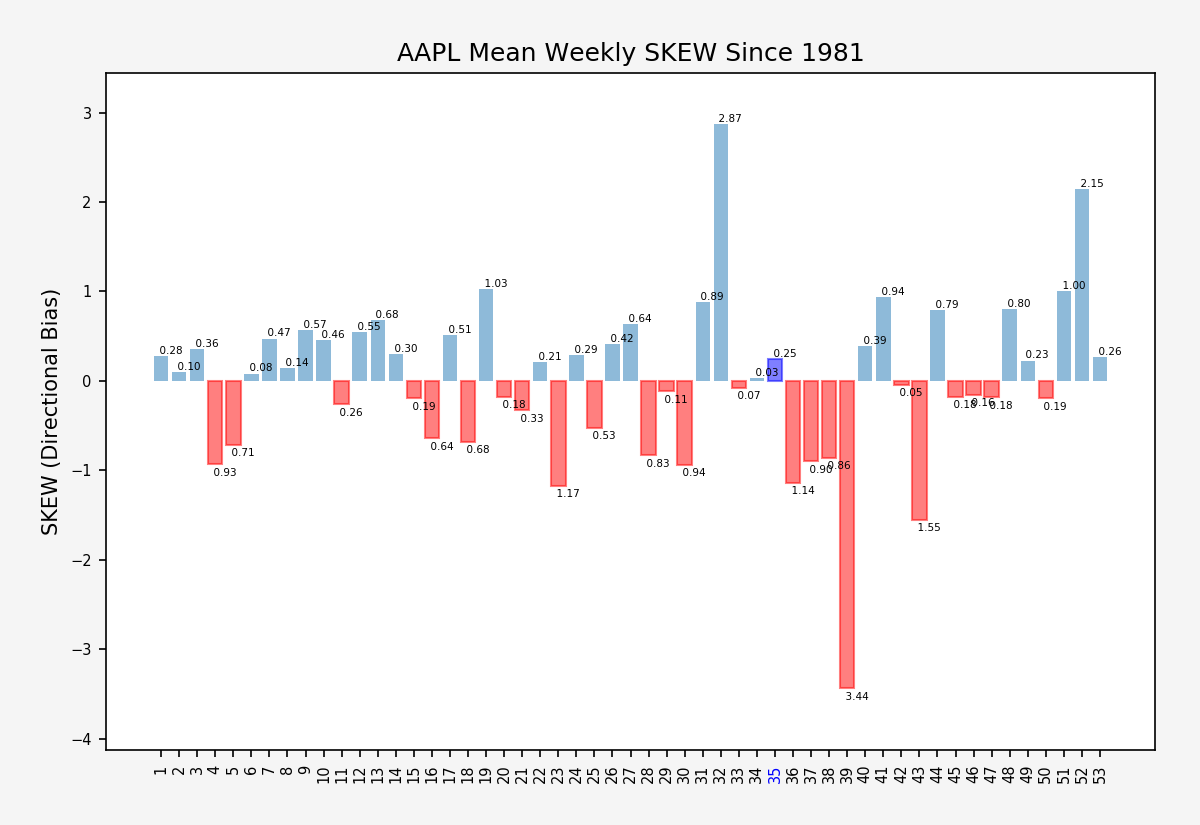
Weekly SKEW – apparently the last week of September is by far the worst.
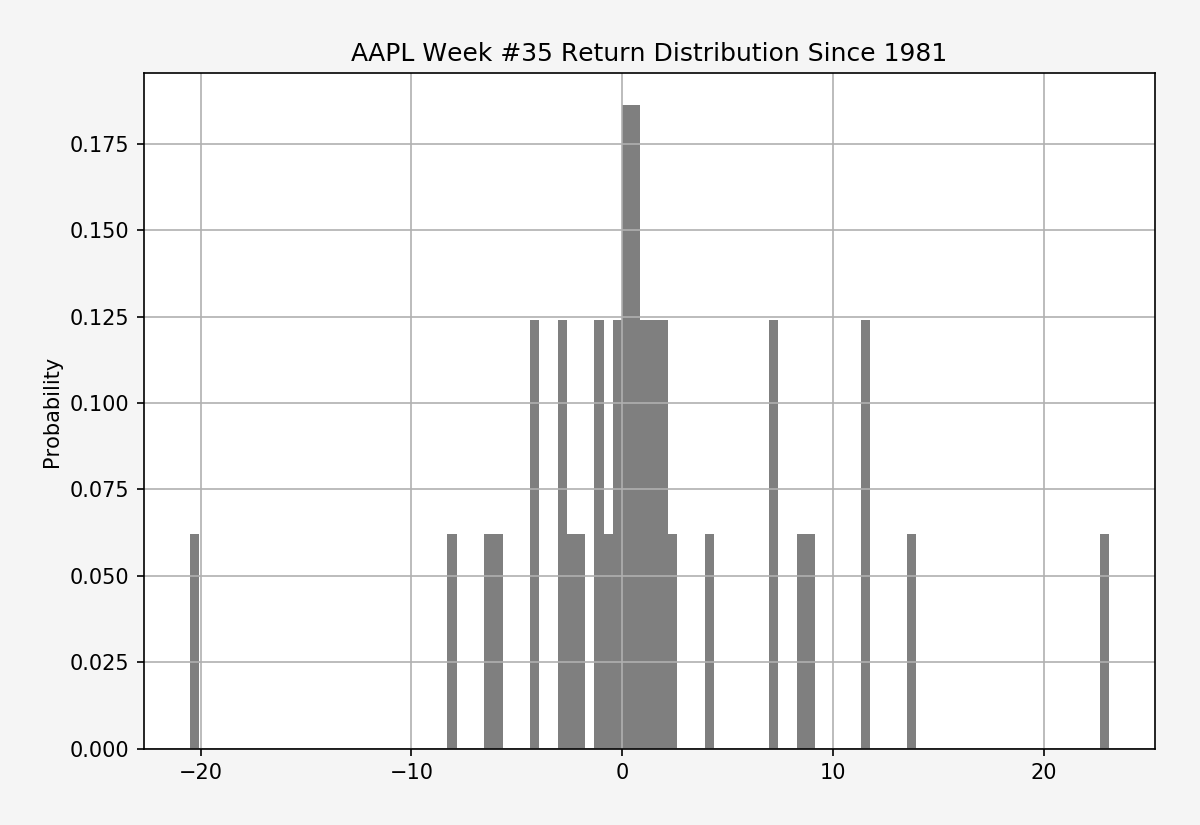
Histogram for week #35, which of course is the current week. It has more outliers on the positive end, which accounts for it being a more favorable month.
I hope you all enjoyed perusing this laundry list of statistical charts as much as I enjoyed building them
Campaign Updates:
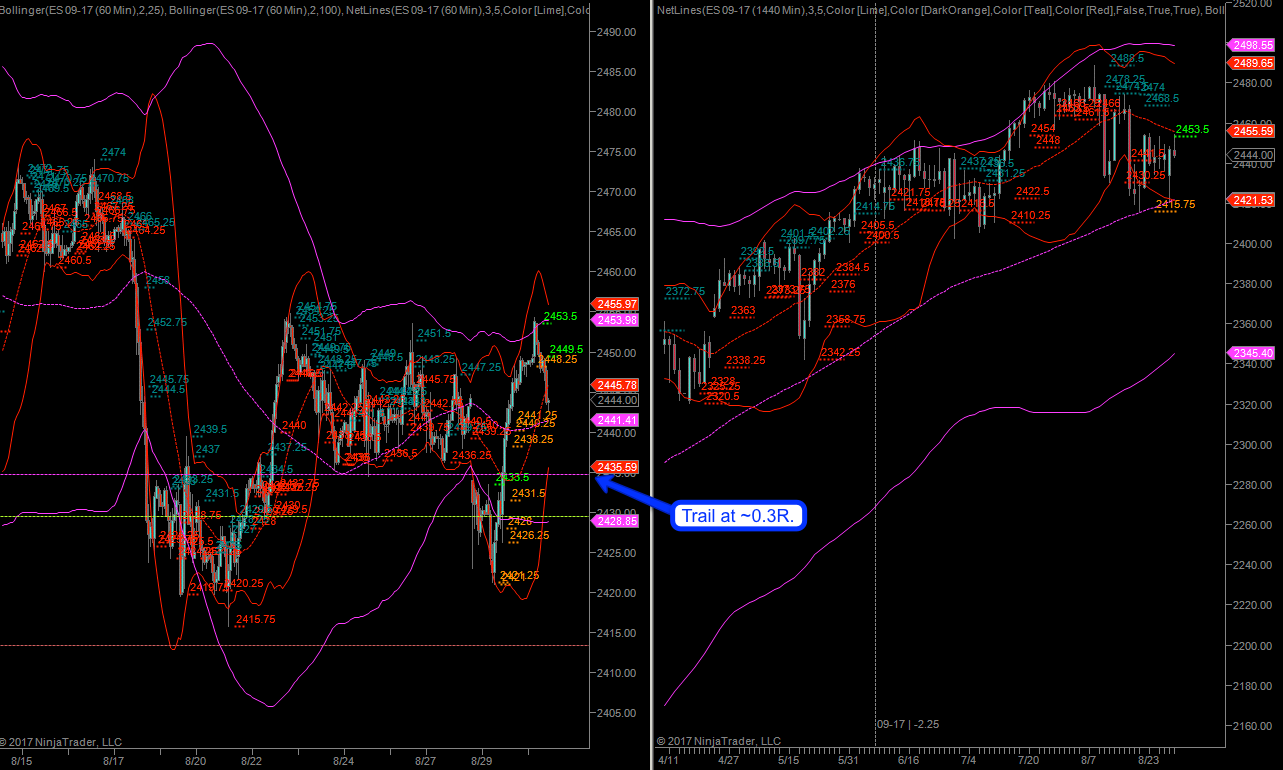
Let’s do some campaign updates real quick. I’ve advanced my stop on the E-Mini long campaign to about 0.3R. Enough to weather out a bit of whipsaw but this thing has to kick higher today or we may slide lower over the remainder of the week. There wasn’t much participation on the Zero yesterday and if it’s just the bots being long here then this drive higher will fizzle out quickly.
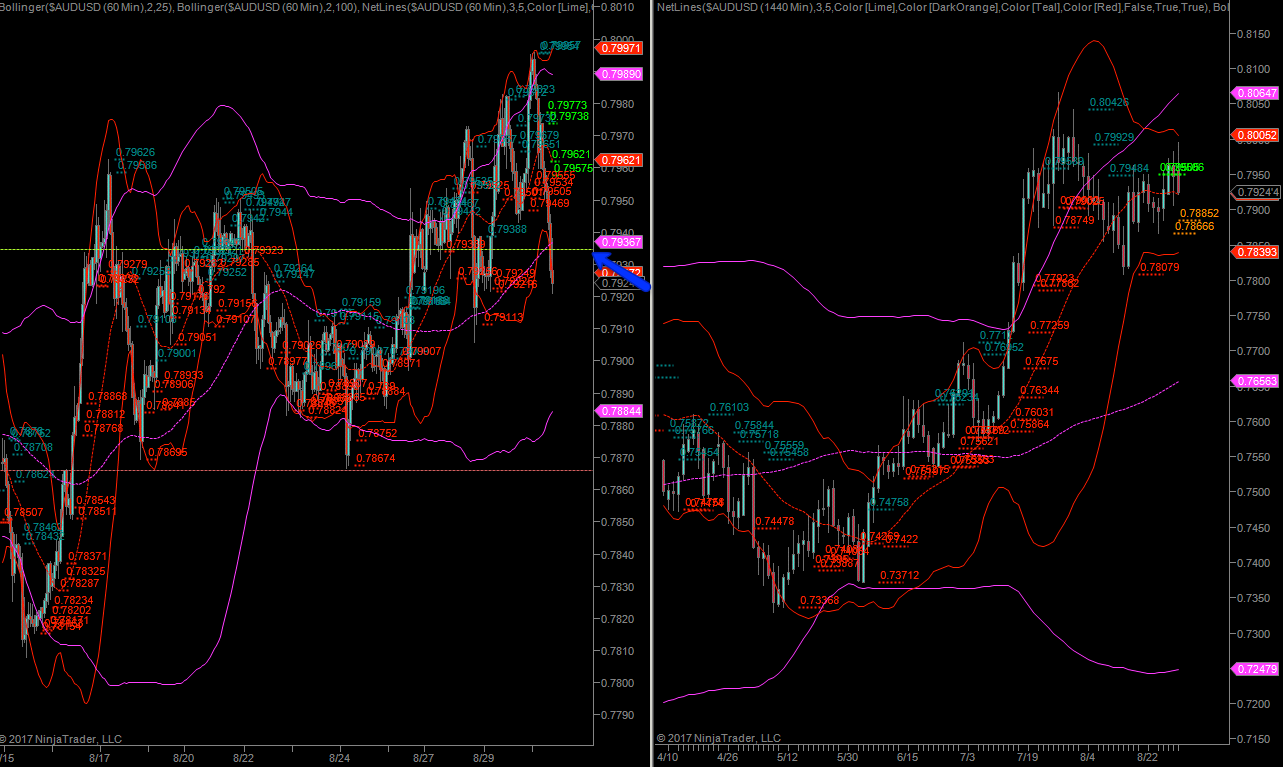
AUD/USD finally got stopped out at break/even. I’m not too sad about this as I’m not a big fan of this level of intra day volatility. Better luck next time.


