


Diagonal Spreads
Diagonal Spreads

Fujisan here.
I like to take this opportunity to say thank you to Mole for all the time and efforts that he has put it in. I have seen enough negative/hostile comments this week, and negative energy is contagious. As I said before, 85% of trading is psychological and anyone with negative thoughts are destined to fail.
Taking a loss is a part of the game, and if people cannot handle the loss and mentally affected, they probably shouldn’t have taken the trade in the first place.
Everybody gets what they want from the market. Negative people get negative thoughts, and positive people get positive thoughts. That’s all there to it. Nothing more.
This applies to life in general. This is not about the market. It’s all about yourself. Market is working as a “mirror” to reflect ourselves. I think this is a very good opportunity for all of us to look into the mirror and see what we got. This is the reason why 85% of retail traders fail.
Thanks again Mole for leading us, and providing us a timely content and market analysis. People have no idea what it takes to put up a posting, day in and day out, not just one, but many, every day. It also takes so much mental toughness to deal with negative thoughts from other people.
Because of you, we are all here. Especially in the time like this, you deserve so much praises and applauses. You are doing an amazing job and you are the best!
DIAGONAL SPREADS
OK, moving on to this week’s topic.
I discussed risk management last week and since then, I decided to build up medium-term (a.k.a. more than a couple of weeks) long positions with specific stocks and stay away from shorting the market. This turned out to be the right decision and I’m very appreciative about this opportunity to make a weekly post. This is a self-fulfilling process and works quite well to reflect my thoughts.
One of the challenges of building long positions with single stock options is that open interests and strike prices are rather limited and bid-ask spreads are much wider, compared with highly liquid ETFs. Accordingly, I have to explore different option strategies other than my favorite butterfly and calendar spreads. I like to use AAPL as an example.
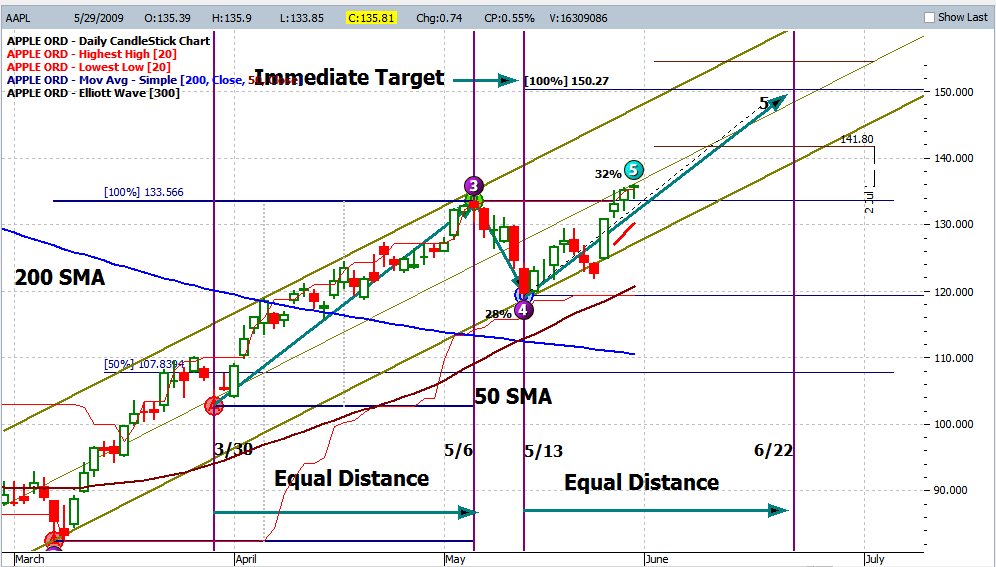
AAPL
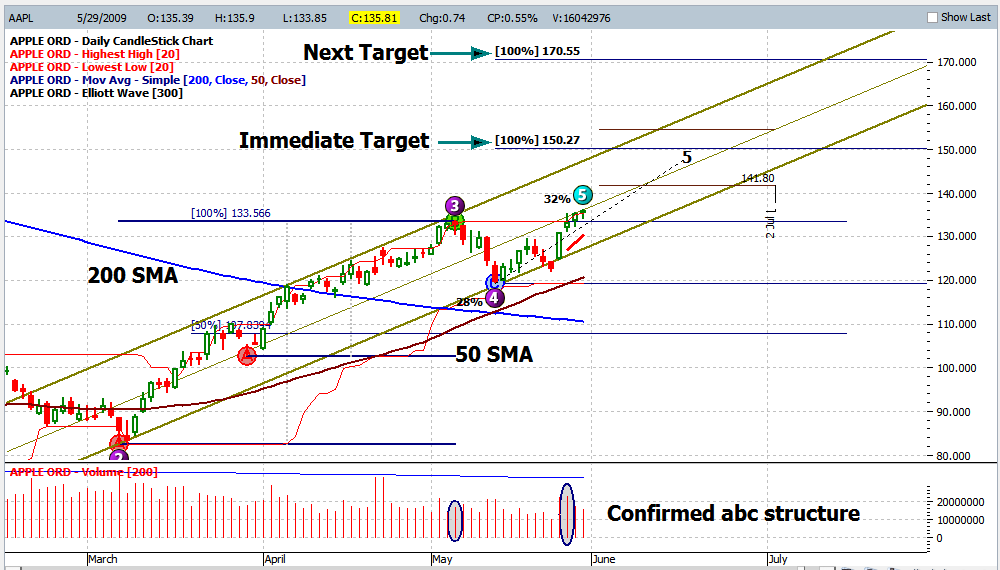
Let’s take a look at APPLE. AAPL is one of a few “confirmed abc up” stocks. “Confirmed” means the previous high was being taken out with higher volume. When this happens, there is a 85% probability that the stock will complete 100% abc extension. I didn’t see this confirmation in GOOG or RIMM but they may go hand in hand as they are the leader of the market at this point.

Now, in this case, the first target (immediate abc extension) is $150 and the 2nd target (the entire wave extension) is $170 with a different timeframe. How can we play this out with option strategies?
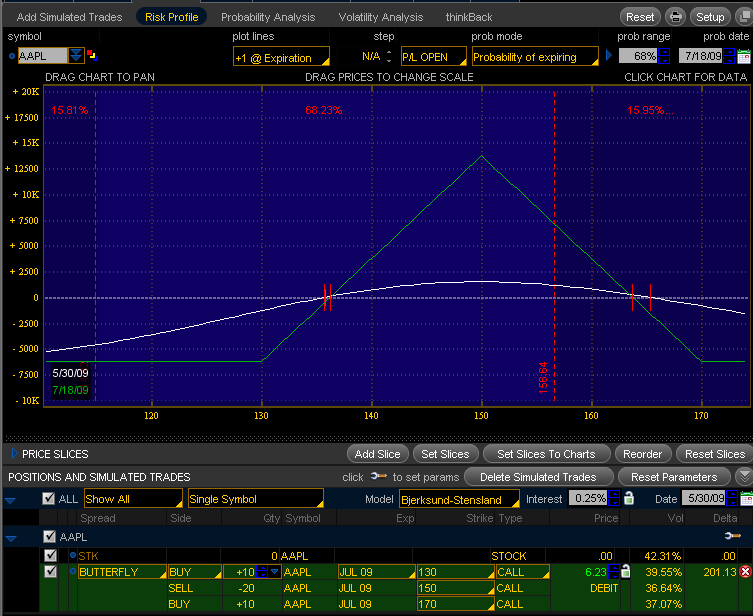
Butterfly
My first pick is my favorite butterfly. As the first target’s time frame is longer than June OPX, I decided to go with July butterfly instead of June. This is July 130/150/170 call butterfly. I will add on Aug butterfly once Aug options become available.
Diagonal Spreads
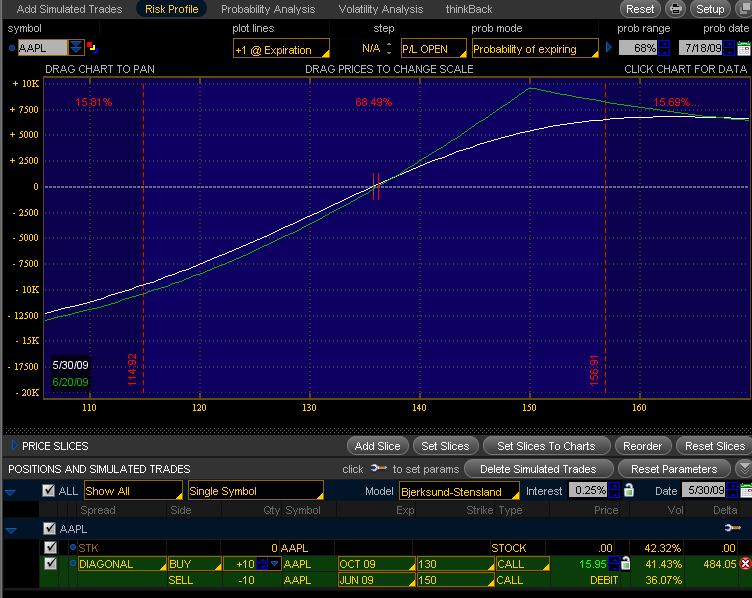
As I’m looking into multiple months price movement, diagonal may be the best strategy in this case. Diagonal is a combination of different months and different strike price options. The way I’m looking at this is that this is a combination of bull call spread and calendar spread. You go long Oct 130 call options and finance this long position with June 140 call short options.
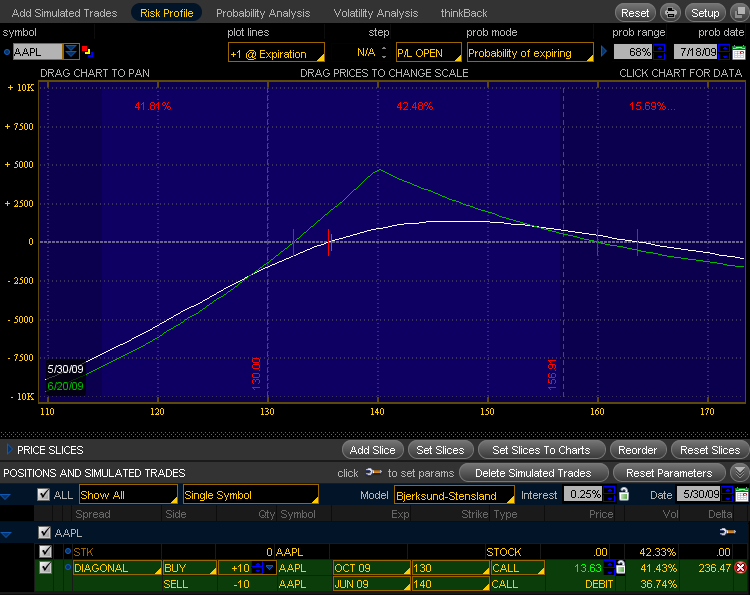
The beauty of this position is that, you could finance Oct long position with June, July, Aug, and Sep short positions with different strike prices as the underlying stocks continue to move up.
Oct 130 long position is currently priced at $16.90, and June 140 call is $3.20. Now, imagine, as AAPL goes up, you can sell July, Aug, and Sep calls against Oct 130 calls one after another, and eventually, the cost of Oct 130 calls could be entirely financed through short options while you are riding on the upward movement.

Boxing Out
Do you remember the concept of three and four legged box that I discussed last week? We can apply the same concept here. The way it works goes like this:
1. First, have July 130/150 bull call spread on.
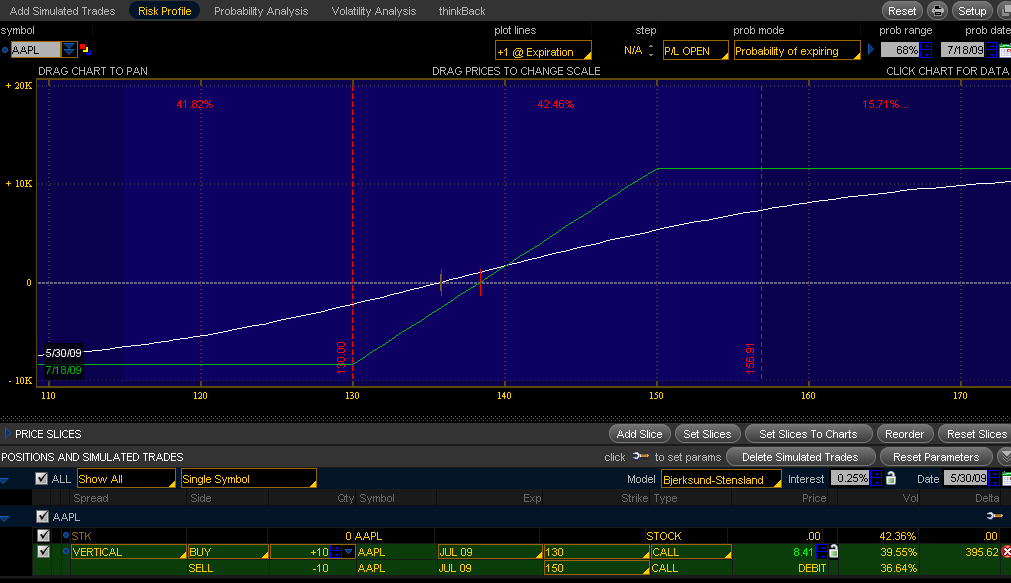
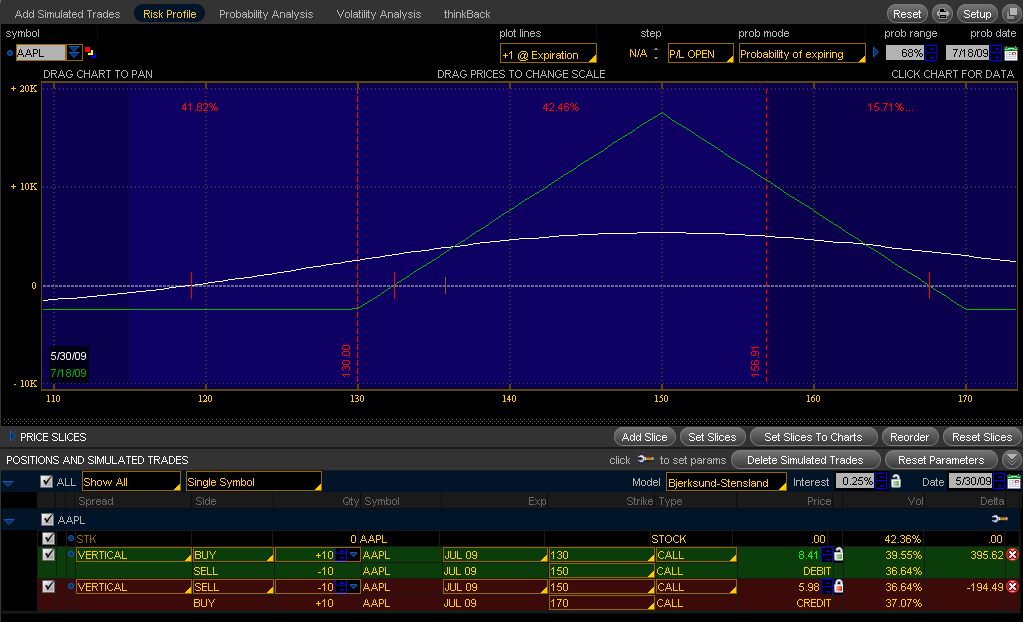
2. Once AAPL reaches the target area, sell 150/170 Aug bear call spread. This will create 130/150/170 butterfly. If you compare this butterfly with the one above, the cost of butterfly is much less and the breakeven points are wider; therefore, better position than the one above.
3. Alternatively, you can add on 150 July puts to 130/150 July bull call spread to create three legged box to ride abc correction after this upside movement is complete.

If you decide to take this position, please wait for a pullback to put the position on. No reason to put the trade on on Monday. By all means, please always have a plan. Set up a stop loss and calculate risk/reward. Get out of the trade when it goes against you.
SMH
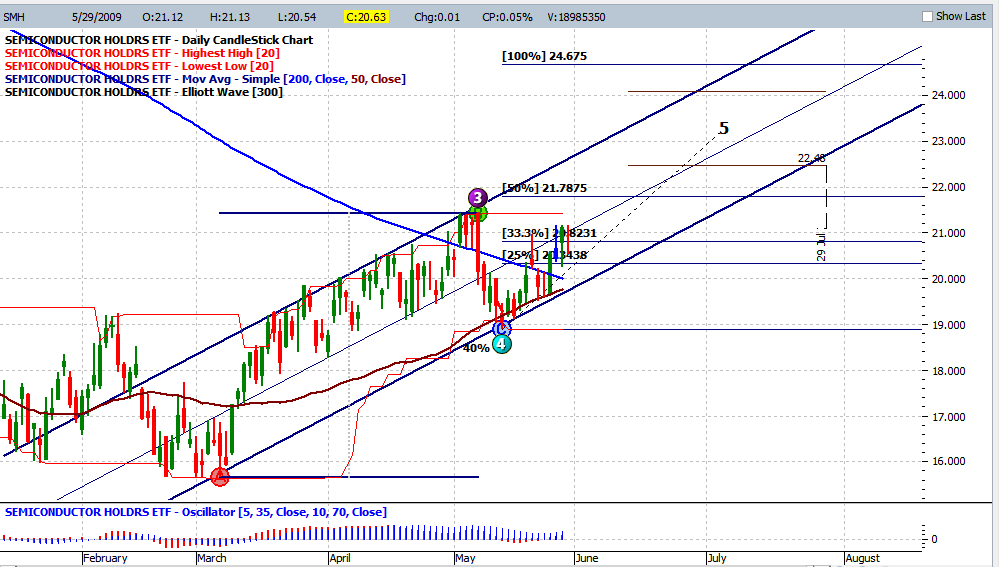
Here is another ETF that is going through multi-months uptrend and yet the open interests are very limited.

If you look at SMH’s open interests, there are in thousands, if not in hundreds, and again, they are not really ideal to set up multi-leg positions.
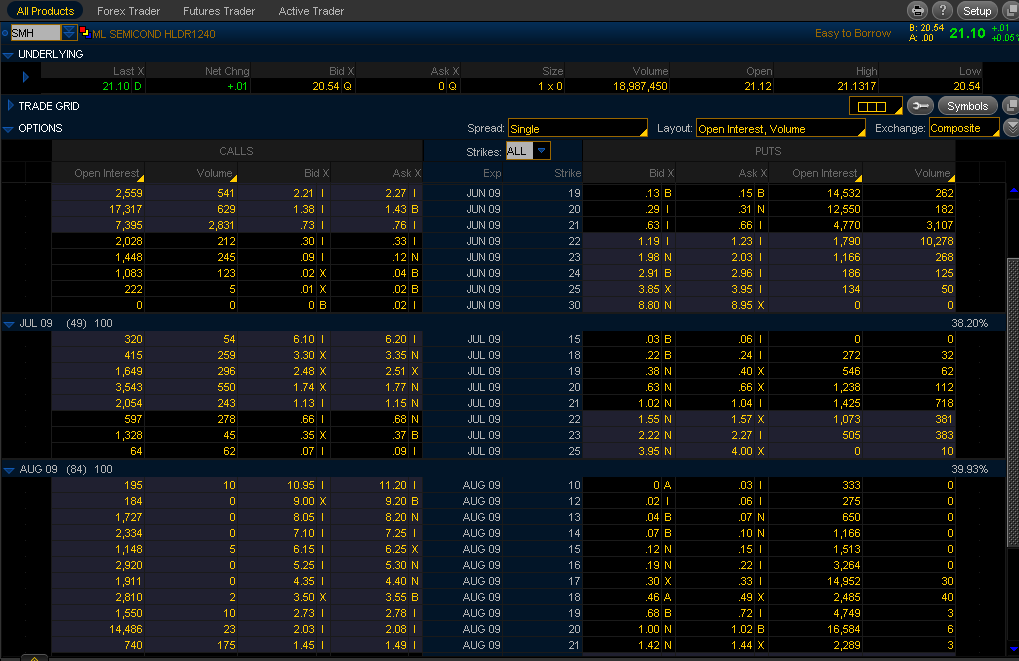
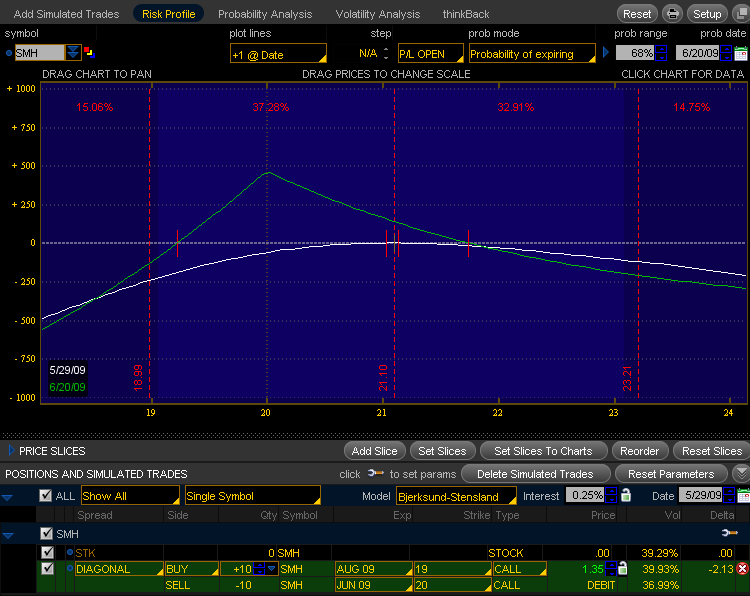
Here is 20 Aug/21 June call diagonal. Same logic as AAPL. You can finance Aug 20 call options with June and July options to reduce the cost of the trade.
I am watching major currency pairs and many of them are at a turning point. Although the correlation between currency and equity market are becoming very loose recently, I’m expecting some kind of turn around next week and the equity market may well be affected.
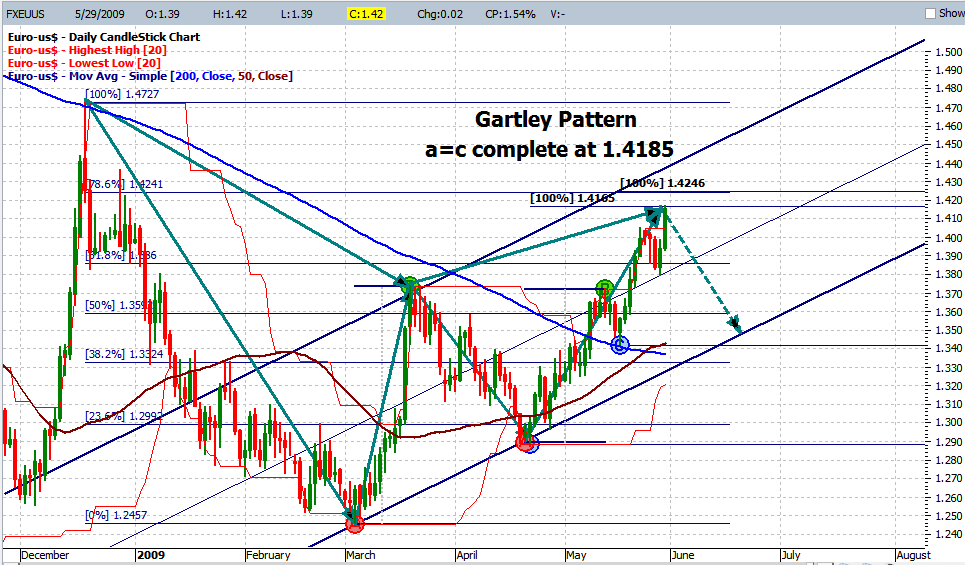
EUR/USD has just completed a Gartley pattern and GBP/JPY is also about to turn. This is not known to many equity traders, but GBP/JPY has the strongest correlation to Dow Jones Industrial Average. When the market turns, I am planning to load up more long positions so that I could ride the market to the upside through the rest of the summer. It’s not worth trading against the major trend and the current trend is clearly up.
It’s all up to us to decide what we get out of the market. Let’s make it a great one!
Have a great weekend.
Fujisan
Sunday Update:
Vidosole brought up very good questions and I decided to address his questions here. His quesions are followings:
“If we are sure AAPL will continue to go up, why we will complicate the things selling short calls, isn’t it?”
That is very true, and if you like, you could simply buy LEAP options, or buy July 130/150 or Oct 130/150 bull call spreads. There is no need to make things more complex. Diagonal inevitably involves an active position management and adjustment. I prefer to finance long positions as much as possible, and that’s my preference, but if you are new to options and like to take a simple strategy, just buy bull call spreads or LEAP.
“Managing of spread positions is from a crucial importance, and I like very much your view about possible different scenarios developments, and hedging techniques.”
The key here is to be aware of breakeven points in both sides. I could buy back the shorts once it goes out of the range and adjust my shorts. As diagonal is a combination of calendar and vertical spread, I adjust diagonal with vertical spread (i.e., buy back 140 and sell 150 call, etc).
If you think Oct/June 130/140 trading range is too narrow, you can have
1. Oct/June 130/150 Diagonal as a start so that you have a wider trading range, or
2. Oct/July 130/150 Diagonal, if you don’t want to worry about an adjustment immediately, or
3. you could simply start with straight Oct long option, and then once long is in the money, add shorts later.
There are many variations that you can work with and we just have to play it by ear. Looking at the chart one more time, I decided to go with Oct/June 130/150 Diagonal as this target might be hit by June OPX and I don’t want to adjust my position so quickly.
“Fuji, I have a question: How you settle your time frame targets ? What technique you apply to do that?”
I count the number of the candles in a particular wave and I expect the same number of candles to take the next wave up. So, for instance, if the previous wave has 20 candles, then I expect the same count for the next wave. I draw a line from lower low to higher high of the previous wave, and make a parallel line to the current wave and see when it hits the higher high of the current wave. This is called “time and price alignment” where you expect 100% time and price extension.
Fujisan
Sunday 2:05 PST: Mole just pointed out that my wording about correlation b/w currency and equity market is confusing so I am clarifying on this.
I am expecting the following:
1. EUR/USD – Short
2. GBP/JPY – Short
3. US Equity – I expect a pullback but I won’t short it. I will load up longs once a pullback is complete and ready to go up.
Here is EUR/USD Gartley pattern and a pullback that I’m expecting.


