


Equity Curve Filters And Compounding
Equity Curve Filters And Compounding
In early 2014 we decided to implement an equity curve (EC) filter into CrazyIvan. The reason for doing so was the realization that CrazyIvan exhibited high dependency, meaning it was cycling through distinct clusters of winning and losing periods. Here is a recent reason example that demonstrates how our EC filter works:
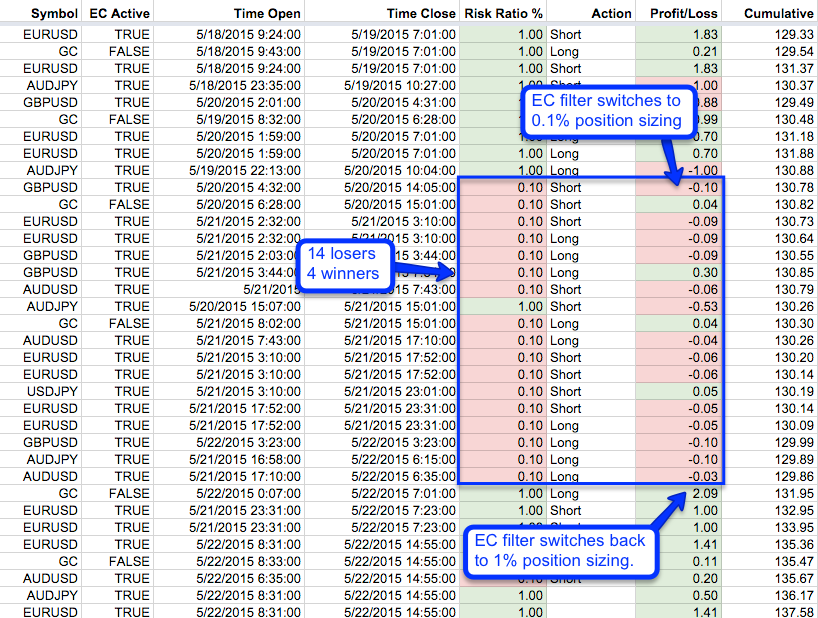
Granted this is a rather idealized occurrence and our EC filter may sometimes activate or deactivate a bit late, which is unavoidable. As there apparently is a high correlation between winning and losing streaks between the symbols CrazyIvan trades and winning campaigns can run for a day or more the EC filter keeps an open cache of open positions in addition to a list of completed historical campaigns. You can find more information about our EC filter here and here.
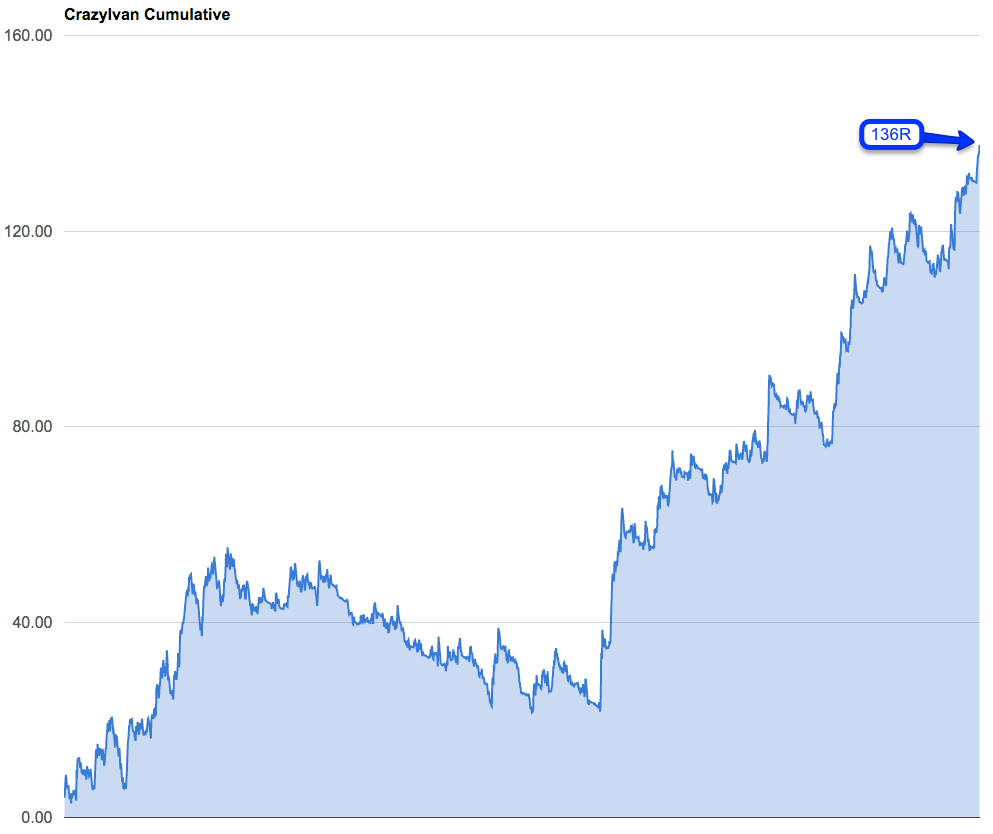
Our cumulative P&L graph currently has us at 136R since 1/1/2014. Now it would be a common mistake to assume that this is tantamount to a profit of 136%. All position sizes in CrazyIvan (and Thor) are based on the account principal. So if your are trading a $100k account your position size (i.e. R size) will be 1% of that – hence $1000 (for futures it will usually be a bit less – I’ll cover that another day). As your account grows or shrinks your position sizes grow or shrink accordingly. Which not only keeps your risk or R size in line with your account but it implicitly produces an effect called compounding.
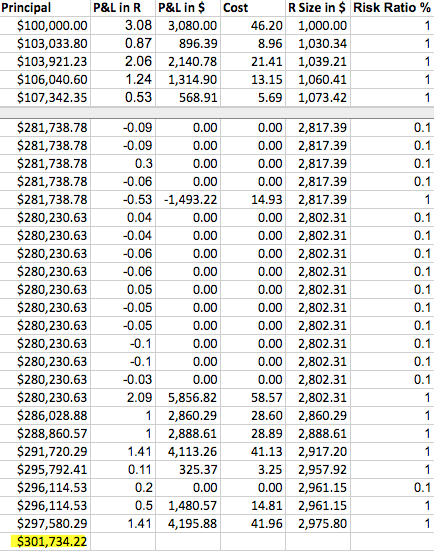
On IB we’ve been seeing slippage of about 0.015R which of course has to be considered. Vankar’s slippage is actually quite a bit tighter as they’re clearing through the institutional branch of FXCM as well as CQG on the futures side – plus you trade 0.1 pip sizes instead of 0.5 pips on IB. However I’m keeping it as an average cost – clearly this will vary from one broker to the next (tip – always always try to negotiate).
Also note that no trades are taken during equity curve wait periods – we still log the trades as the EC filter requires those numbers. In any case – you can clearly see the impact of compounding – instead of $236k it has climbed to $301k (including avg. commission and slippage). And over time that really starts increasing your leverage. Something to ponder about and this is why I always caution you against taking large risks on a particular campaign. Instead take small risks over time and let compounding work in your favor. Remember – the results above only represent 17 months of trading CrazyIvan – the goal is to maintain a reasonable growth rate over many years to come.

It’s not too late – learn how to consistently bank coin without news, drama, and all the misinformation. If you are interested in becoming a subscriber then don’t waste time and sign up here.
Cheers,


