


Eye Of The Beholder
Eye Of The Beholder
Yes, it’s that time of the week again – when Mole’s mental gymnastics attempt to catch a small glimpse at what the future might have in store for all of us. Let’s not forget – no matter which way the tape swings, for every winner inherently there will be a loser. The market is a seductive but cruel mistress whose insatiable appetite for an unremitting flood of gamblers and suckers is only matched by its merciless swiftness when enacting punishment on any poor soul lured into betting on yet another ‘sure thing’.
My goal in presenting the following charts, views, and analysis is to keep you out of reach of the most punishing blows the market insists on dishing out. That doesn’t mean you will arise a winner at the end of this week – as Albert Einstein used to quip: “Two things are infinite: the universe and human stupidity; and I’m not sure about the universe.” No matter what I say or suggest here – someone somewhere will always find a way to blow up one’s account 😉
Seems like the bears have now either completely capitulated or sought shelter in the camp of the sophists, where everything is relative and up means actually down. After all – if you turn your monitor 180 degrees we’ve been in a nasty P3 bear correction for over a year! Seriously now – I was horrified to come across some musings of a popular perma bearish analyst who insisted that the recent correction he had predicted (several times) had only occurred in momentum indicators, but had not been reflected in actual price movements. Hey, can you say ‘virtual correction’? 😉
Not that I’m bullish myself – you could call my current disposition ‘delta neutral’ at best and ‘stay the fuck out’ at worst. Although the pickings are meager this week, here’s some of the evidence I managed to collect in the past few hours:

This chart should give any bear the willies. Some of your regulars might recognize my exotic 10-day MA NYSE Advancing/Declining Volume chart. BTW – the next guy who calls a daily MA chart a ‘DMA chart’ will receive a courtesy visit from my Evil Speculator ninja team. A DMA is a Displaced Moving Average – and while we’re on the subject, a DEMA is a Double Exponential Moving Average. Accuracy is key when it comes to charting and I expect no less from my readers. Now drop down and give me fifty – that’s right Stainless Steel Hamster – no girlie pushups in this squadron!
Anyway, back to the horrors of the chart above. I have pointed out obvious bounce points which seem to follow a diagonal trend line. Only problem is that we didn’t get a significant drop ahead of a bounce this time around. Maybe it was due to April 1st foolishness but we kept on pushing up without as much as a glitch in the Matrix. Does this mean I’m turning either more bullish or bearish? Sorry, but I’ll have to go with option c) which is to mentally check out and leave it up to other fools to toss their chips onto the roulette table. I only make bets (or trades) when I feel that the odds are on my side – right now I am not experiencing that warm and snuggly feeling. Maybe I should get laid more often.

Next runner up is one of my favorite charts – again a 10-day MA (or SMA) of the CBOE put/call ratio index – very eclectic stuff, you should only look at this chart whilst munching white truffle and sipping a glass of Cristal. Well, the sad news is that this chart is telling the very same story – we extended down as we rightfully should when buying frenzy begins to resemble bloody chopped liver tossed into piranha infested aquarium. Except that there seems to be an endless amount of chopped liver out there and the piranhas just ditched their carbs only diet. Caveat ursi indeed.

This chart is more of a long term perspective, but that’s really what our weekend forecasts are for. Step outside the battlefield for a moment and you might find rushing rivers, lush meadows, and mountain peaks ideal as vantage points from which to plan your new strategic assault. In all seriousness – this chart bears watching despite the fact that divergences of magnitude only occur every few months or so. But they usually precede significant corrections – except for the very last time of course 😉
But perhaps the 90 level on those two moving averages is where the rubber meets nothing but air Wiley Coyote style. Personally I would love to see a bit of a down trend from 90 into 80 in those two averages accompanied by a price divergence (that means prices would continue up you knuckle head). Those are the times you know something juicy is coming – but thus far it’s not happening just yet. So, keep on munching on those discount 1980s MREs you’ve got stacked up in your nuclear basement bear bunker – time is not ripe just yet.

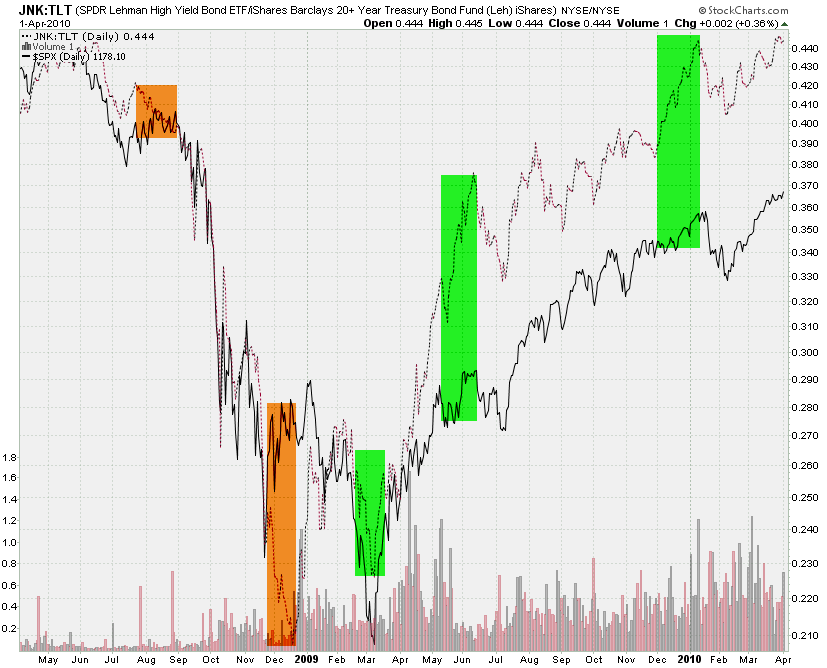
You also ought to look out for divergences on this sweet puppy. We are looking at a spread between JNK yields and 20 year treasury bond yields (yes, yes – this is the inverse of the 20+ year treasuries – same difference). I think the charts says it all and bears no further explanation. Again, nothing really fantastically bearish on the horizon. BTW, no matter what anyone tells you – TBT is not an explosive and you can buy it in large quantities. Just don’t mix it with fertilizer and gasoline – might blow up your portfolio.

Here’s a special treat for you point and sticky figure (P&F) lovers. Had I looked at this chart at 1060 I would have surely posted it but I don’t always remember to pull these things up – but I will look more often going forward. What I’m seeing right now is that 1220 may be one sweet shorting opportunity. Assuming we get there and maybe some of the charts above start playing ball as well. Yes, that’s how a merciless ram up looks like on a P&F chart.

Last but not least our wave count. Since we’re in a third wave it seems there is not much to say except for ‘if it breaks it breaks’ – this thing is on an overdose of Viagra and should seek immediate medical attention (may i suggest a vasectomy?). My fib extensions now are suggesting either the 1200 or 1220 cluster for a possible short term reversal. However, based on what I’ve shown above we could be pushing higher.
What – no bearish count, Mole? Well – if we breach 1,155 then I will entertain that notion. But I don’t see much that screams bearish – sorry folks. And that’s of course unfortunate as none of us want to start chasing a trend so late in the game. So what are we going to do? What you guys are best at – absolutely nothing! Or do what I did since Saturday morning – play with that shiny new iPad 🙂

Call me technically challenged but I can’t figure out how to sync that thing with iTunes. And the hair on my back stands up every time I use the touch screen. Getting a feeling that guy who sent me that ‘pre release version’ might have ripped me off.
Well, of course doing nothing is not an option here at Evil Speculator but let’s stay at least delta neutral – no matter what we do. I will try to balance bearish symbols with bullish ones for the immediate future – would be nice to see you guys throw a few over the fence as well. Good setups will get posted and will receive appropriate street creds.
Cheers,
Mole


