


Living Inside a Broken Clock
Living Inside a Broken Clock
Fri Nov 20, 2009
gmak’s Pre-Market warm up.
Here is a mobius strip of a statement: “We are overdue for a Black Swan event”.
The financial system is a series of reservoirs that are all interconnected. At equilibrium, liquidity comes in as drops into the Intermediary (Financial Institutions) reservoir. This overflows into one or more other reservoirs (asset classes) based on regulatory rules until a balance is established. The system takes a while to balance and changes are usually mild. Every now and then, buckets of liquidity get dumped into the financial system and there are more turbulent waves that make their way between and over the various reservoirs.
Now, armies of NY trolls are tossing buckets of liquidity into the Intermediary reservoir and all the other reservoirs are so full that there are turbulent waves that occur before the system can settle down. Worse, the buckets keep coming like the twisted result of a Sorceror’s Apprentice.
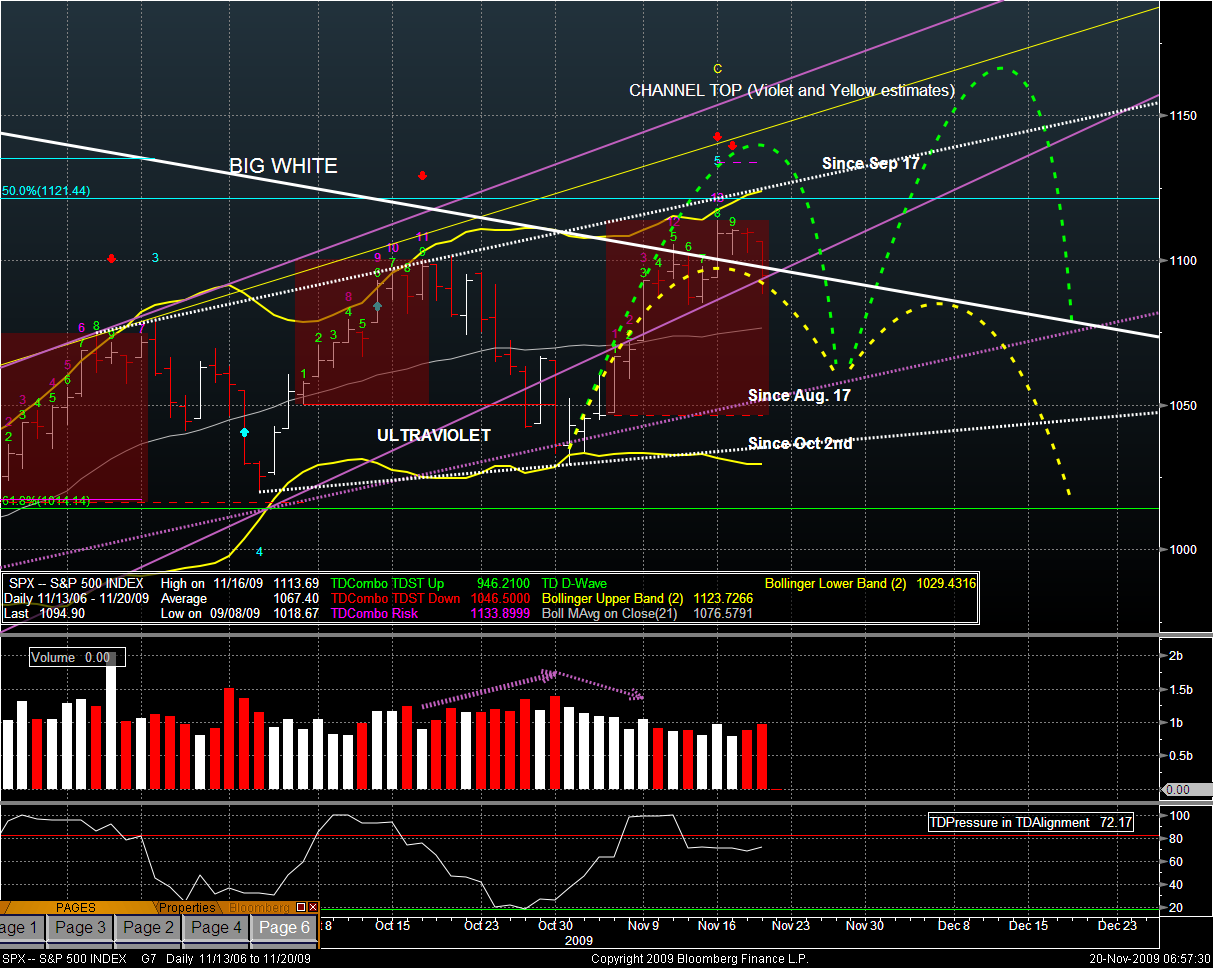
SPX has shown us two red bars in a row, on rising volume. I did mention that the perfected TD SELL setup meant a retrace of 1 – 4 bars, as a rule. It’s hard to see in the chart, but SPX closed just a touch above the ULTRAVIOLET trend line (since the March low). A pin through is not a break. It still looks like SPX wants to head down to the “Since Aug 17” trend line – but it will likely not be straight down, if it occurs. Look at TD Pressure (the bottom graph in the chart). It has curled up a tiny bit, even though SPX is down. Further, the BUY setup that started yesterday is gone, as SPX did not close low enough.
I would expect SPX to generally trend down with the odd up day (white bar), with support at the mid-bollinger, and Buyers coming in at the dashed red line just below the “Since Aug 17” trend line. Today will likely register the 1st bar in a new BUY setup (which is declining prices) as the 4th previous bar closed up around 1109 – which SPX should be below today.
The momentum has shifted to the downside in the short term, even if many are too punch-drunk to be willing to play that.
Equity
Asia was mixed, but the important markets were in the red – even China by 0.83%. Europe is red but on the order of 0.50%; The DAX is down 0.36%.
Why I harp on the DAX is because, as TraderJane, Carl V, and others can attest, it tends to be the long lost twin of the SPX. As you can see below, Basic Materials and Telecom are the green sectors. Look at the UP column and it tells you the proportion of index members that are in the green. It is interesting that Utilities are in the red with this layout – because they are a “safe haven” as a rule, no?

The DAX opened down and then fell off a cliff around 5AM EST. There are rumours of a Ukraine Debt default that have been swirling around, and this has also affected the EUR. Black Swan? Did someone mention a Black Swan? If you want to see chaos, watch the DXY if this rumour turns out to be true.
ES fell off a cliff (relatively) about the time that the DAX did. Right now, the pivot at 1084 is acting as support.
Pivots:
R2: 1119.75 = Would be a new high, but not today, IMHO.
R1: 1107 = Was resistance yesterday between midnight and the NY open.
Neutral: 1096.75 = was the floor before yesterday at 8:30 (NEWS time) when the waterfall happened
S1: 1084 = The floor right now; Puts SPX just below 1088 – which is still above several telling levels.
S2: 1073.75 = The bull’s next dip buying level if 1084 gives way.
FX
USD is stronger, and above the level that I mentioned yesterday which creates a higher high. CAD, JPY, EUR, and GBP are all weaker. There is a bit of fear in the air due to the Ukraine default rumour. There is never just one cockroach, and the markets are all too aware of the risk profile of the E. European countries. It probably doesn’t help that Trichet (ECB) mentioned withdrawing liquidity gradually – no one wants the punch bowl taken away, even if slowly.
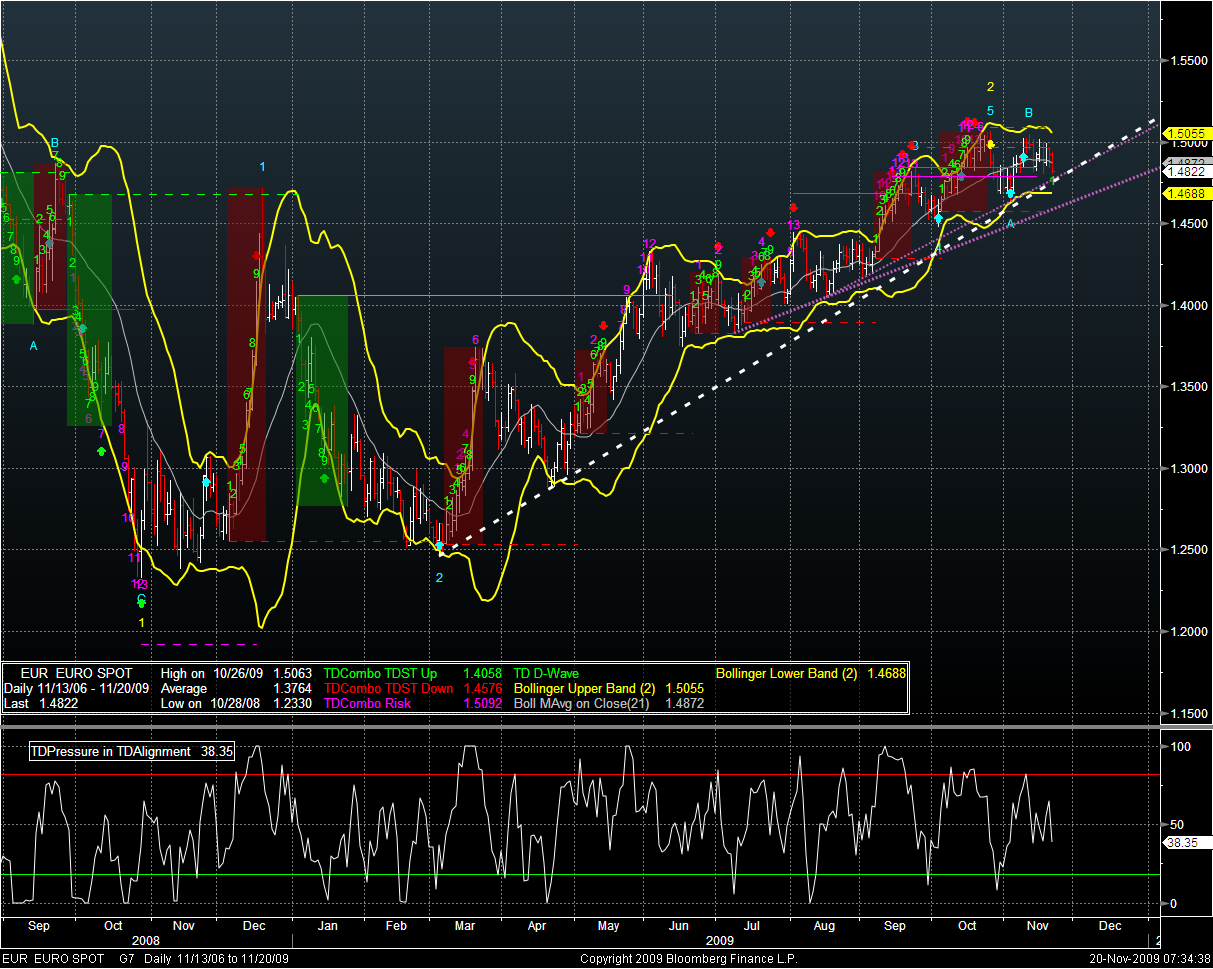
Here is my long run chart of the EUR. The dotted lines are trend lines. The dashed horizontal red lines are TD support levels where buying is expected to come in. Even with the nasty Ukraine rumour, the trend lines have not been broken and EUR is clinging to the middle Bollinger still.
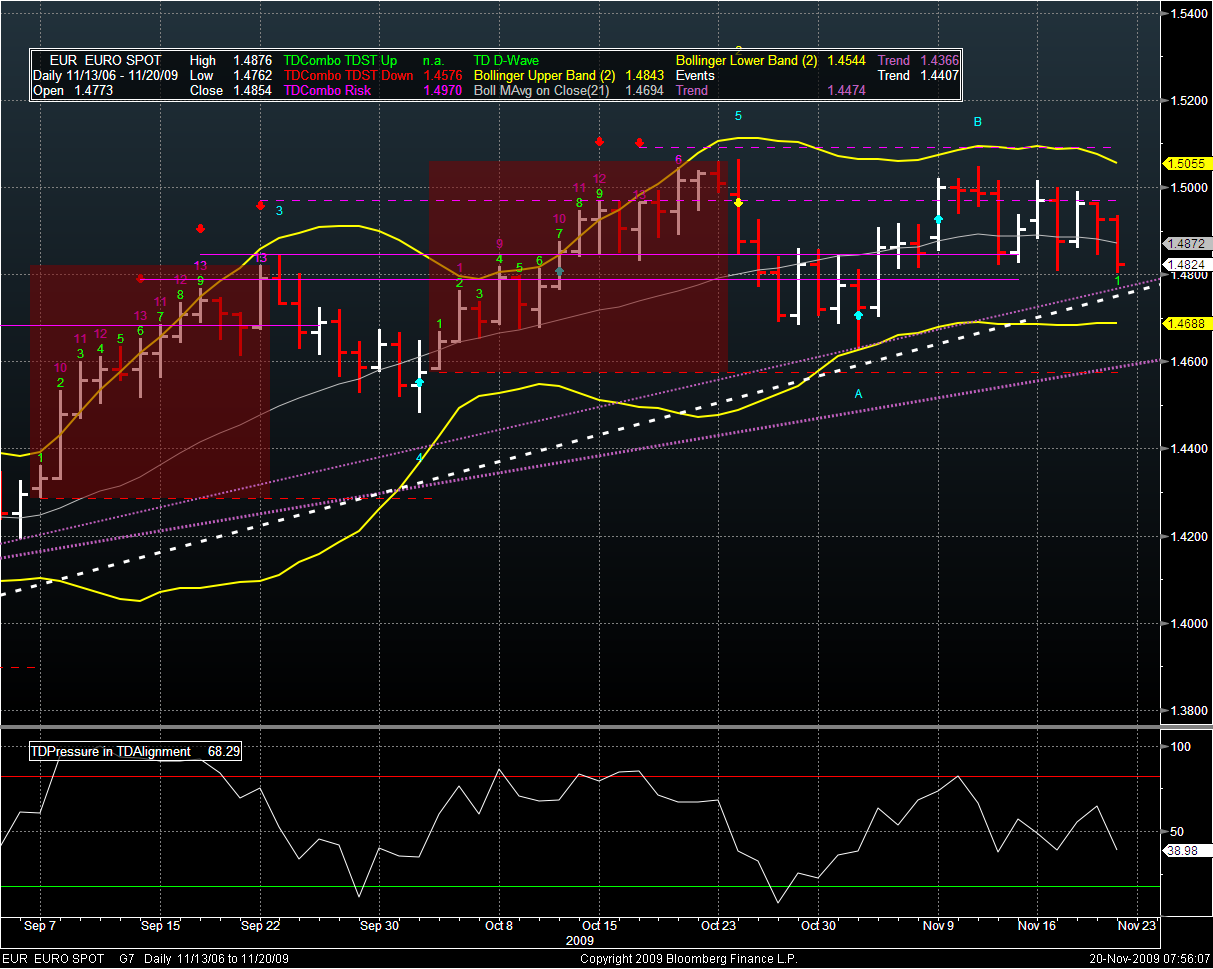
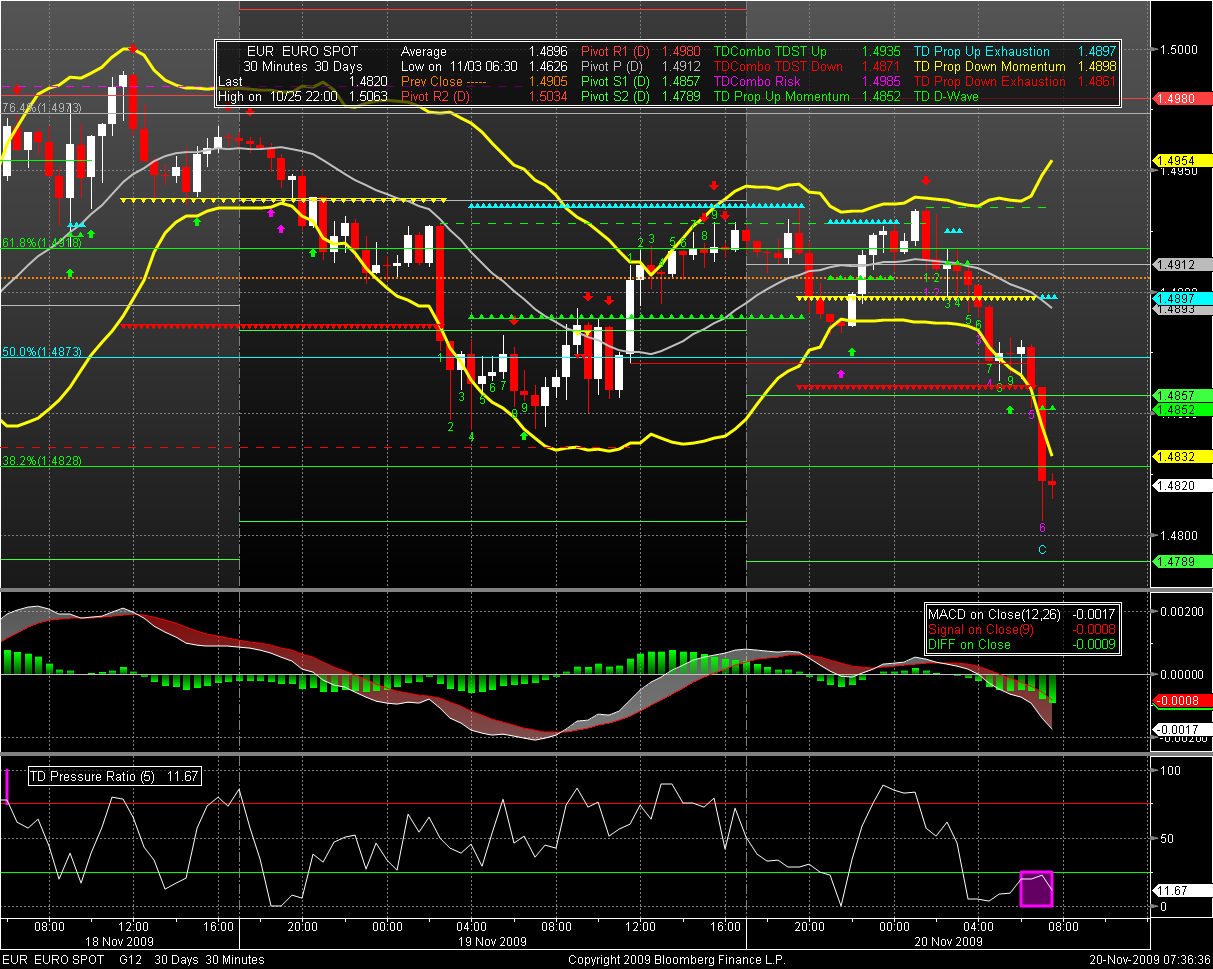
The 30 min EUR chart above shows how staunchly the 1.48 level is being defended by China, which apparently has the “do not touch” 1.48 – 1.51 option that expires today. It almost seems like a lost cause as a number of support levels have been broken decisively. The pink box for TD pressure (at the bottom of the chart) says that the oversold elastic can go on and that selling pressure is the rule. It’s hard to defend a level – that is not a TA level where there would be buy stops – so 1.48 will likely fall without help for China coming in big time.
The level to watch is EUR = 1.475, which is the long run dotted white trend line. The serious “USD bears get crucified” level, is at 1.4576 – which is a TD support level. If this is breached, then there would be a serious move to unwind the USD carry trade – an elastic snapping back.
NEWS
The Ukraine rumour.
Trichet says ECB will withdraw liquidity. See below for the main headlines.
Data
NONE today. You can see more here;
http://www.briefing.com/Investor/Public/Calendars/EconomicCalendar.htm
FED B/S
Reserve balances with FED banks rose for the week ending Nov 18, 2009 by about $65 bb. IMHO, this is liquidity that is NOT in the financial system because it is on deposit with the FED.
MBS held rose to $884 bb; just about $400 bb to go to the 1.25 Trillion possible. Don’t underestimate this possible impact over the next 4 months, on the risk markets.
Have a fun day! I don’t trade OPEX due to the swirling winds.
Cheers,
gmak.
p.s.
Gordon Ramsay is a raging bear:


