


Living Inside a Broken Clock: Friday, April 16, 2010
Living Inside a Broken Clock: Friday, April 16, 2010
by gmak
March Foreclosures were a record. The light is starting to shine on the B/S (balance sheets) of so-called banks (hedge funds getting zero percent money from the FED and loss insurance from the FDIC). The jump of over $400 billion in lending recently was an accounting change – more light but not more reality as they continue to be marked at book.
The battle over second mortgages continues, as banks are loathe to mark them down (at a cost of $700 – $800 to the industry, as estimated by Chase, so consider the source and their vested interest to keep them on the books). These second mortgages are standing in the way of any adjustment for underwater homeowners. The home owners are wearing a wet leather suit, and it is drying in the sun of time.
Another interesting datum is the fact that it takes 100K jobs a month to stay even with population growth. Last month, 162,000 jobs were created. Let’s say that this gets up to 200K per month. To get back to the employment levels of before the crisis (over 8 million jobs lost) would take 80 months (at 100K per month), or 6.5 years. If one includes the ‘marginal’ not-looking -for-work, the period extends. That is not a rapid growth recovery.
I think that we are going to see more aggressive reindeer games in SPX, as it looks like this is the only way that the FED and the financial elite can ‘re-inflate’ the wealth of households, or so they think. I believe that any increased consumer muscle is coming from all the non-payment on mortgages. Give me an extra $1,000 -$3,000 per month and I’d probably spend as well.
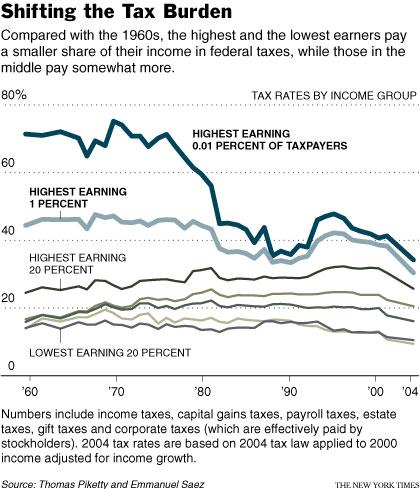
And how will this be all be paid for in the end? It seems that over time, the wealthiest and the poorest have been climbing on the backs of the middle class. It’s hard to improve your lot in life if Uncle Sam is making you pay for everyone else. If you say you will rob Peter to pay Paul, Paul will vote for it every time. Where do our political and financial elites fit in this economic strata? Likely at the top.
Borrowed time, borrowed money. The bill won’t come due for a bit, but our grandchildren, and their children will be cursing our generation as they slave for the political and financial overclass. Welcome to the broken clock.
To keep things in balance, here are some positive signs that the reflation might be working:
- The stock market continues to move up and the Treasury is still able to fund its needs at low interest rates
- Port traffic in LA is up in March. This is a precursor to an increase in the trade deficit (more imports). An increase in the trade deficit means more USD available in the hands of foreigners to buy Treasuries – helping to keep yields down.
- Mfg and capacity utilization are up; Inventory rebuild has begun. Economy-leading companies are showing bottom line gains; Hiring has started again in some sectors.
- The trend in tax receipts has reversed and is beginning to trend up.
As a public service 🙂 for those who are curious about who actually owns their representatives, you can follow the money at this site:
http://www.followthemoney.org/index.phtml
OverNight
Asia was red down to the last city nation. Europe is mixed – but France and Switzerland are green among the ‘biggies’.
The DAX gapped down, but then filled that gap and went on to try to test the high from yesterday – and failed. It looks like 6250 is support and 6300 is resistance for the nonce. Leading the charge are the health care, consumer discretionary, Telecom, and Materials sectors with good breadth.
ES sold off overnight by a whopping 6 points, but has been recovering off of the Europe open It looks like the ES can act as a predictor for the DAX open sometimes. My concern is the preponderance of retail level call options that are out there, and what that might mean for the indexes.
There are many individual names where games will take place, and this will have an (unpredictable) impact on the indexes. At the same time, there are games in the futures – but since index options don’t mature today, I doubt that these games will be serious. My thoughts are that many of the individual names will be sold in order to minimize the call gains, and this will have a downward move in the appropriate index. Just thinking out loud.
ES Pivots:
- R2: 1216 = Just another ledge on the climb to the SPX 62% FIB at SPX = 1228.74; I would be surprised to see this fall today given the OPEX games.
- R1: 1212.25 = Will probably be attempted. OPEX tends to be a war between various agendas, and that usually leads to range bound moves. This could be a good area to short the range.
- Neutral: 1206.50 – This has been resistance, and now support, all night. It looks like this will be at least a way station on any range-bound moves. Right now, ES is trying to consolidate here for an attempt on R1. There is a bullish cross on the 9 and 34 pMA, but it is weak and not supported by TD pressure, yet. Any move up before the open will be faced with TD resistance at ES = 1210.25
- S1: 1202.75 = This was support overnight. I see this as the bottom of the range for today. Range trading means appropriate stops at the ‘turns’ in case the move occurs. Like I said, it’s hard to imagine a strong move one way or the other on OPEX Friday.
- S2: 1197.25 = Well, the bears can dream.
Data for today: Housing starts, building permits at 8:30; U of Mich. confidence at 9:55; Leading Indicators at 10AM = don’t forget that the stock market is a big part of this and it is a self-fulfilling prophecy.
This is the SPX Daily Chart with FIBs.
As you can see, SPX has moved above both the 5th wave retrace (blue line that ended on Wednesday) and the TD Risk level (purple dashed line that begins at the purple number ’13’). At the same time, the pink box has begun in TD Pressure at the bottom of the chart. This usually means that the trend will continue – especially since SPX has moved above those resistance lines with conviction = opening higher and closing higher still.
Volume has been increasing even as SPX moves higher – something that we haven’t seen all that much. I would suggest that a lot of that volume is from the 5 zombies (C, BAC, Ambac, etc) and that selling is increasing in other areas.
Ignoring today, I expect SPX to test the 62% FIB – maybe even over-throughing it if the conditions are right. I then expect the fear trade to tag out the risk trade and SPX to have some kind of correction – remembering that there is a lot of technical support underneath (SMAs, trend lines, TD indicators).
For the first time in quite a while, it looks like the 55-day SMA slope is increasing at least as much as SPX. This is a necessary stage for the end game on this run.
Here we are at 32 days for SPX to be above the 55-day SMA, and no signs of a letup. Every day where CLOSE = OPEN approximately, is followed a day or two later by a stronger move up. SPX is now just over 7% greater than the SMA – for the 5th day above 6%, which is getting beyond the usual span of time for this elevation. SPX is getting stretched. Yes, it can continue – but I don’t think that it will be with conviction. That 62% FIB in the chart is certainly a major, major psychological barrier.
As I said above, SPX is within spitting distance of the 62% FIB (based on the all time high and the 666 low from March 2009). This is usually a turning point. Do androids dream of FIB numbers? It seems a logical target – a thirsty steer to water analogy. Draw it and they will come – meaning that it is as good a target as any for a retrace in the current mindset.
SPX closed the day as a ’33’ following Wednesday’s ’15’. The odds for yesterday favoured a CLOSE < OPEN, but that didn’t happen. That’s two days in a row that the probabilities went with the less-likely scenario. For today, they are: CLOSE > OPEN = 45.9% CLOSE < OPEN = 43.2% for the ’33’; and for the combo of ’15’ and ’33’: CLOSE > OPEN = 47.8%; CLOSE < OPEN = 34.8%. Looks like CLOSE > OPEN is the most probable scenario. Since it is OPEX Friday, who knows how it will play out. Given the high level of Call options at the retail level, I would expect a down day, just because…. However, OPEX Friday is always a war between many different parties with many different vested interests – and range moves are more the norm than not, IMO.
The EUR has come back down, in a beautiful waterfall from just before 6 AM (and off of a bullish flag I might add) to hit near the lows from the previous day. My TA says that EUR will try to move back up before falling some more (there is a pivot at 1.3508 that will likely have considerable support for the EUR – especially if there are barrier options just below). The Bollinger bands have narrowed – and volatility reverts to the mean which means a widening. This suggests a strong move in one direction or the other. IF EUR makes a move up, I see resistance at 1.3544 and again at 1.3555. Support is at 1.3521 and again at 1.3508.
CBs are trying to talk the EUR up with positive comments about Greece. However, worry is beginning to rise regarding Portugal – so I think it is just a matter of time before EUR’s pretty little head is pushed down again. Just remember that the Swiss National Bank is very concerned about a strong CHF and may be buying EURUSD and selling CHFUSD.
By the time you’ve read this, the situation for the EUR could have changed. I wrote the EUR piece at 7:46 AM.
[/amprotect]Don’t try to read to much into the moves on OPEX Friday. Monday is another day – usually an up one.
My Best Regards.


