


Living Inside a Broken Clock – Tuesday, Dec. 8, 2009.
Living Inside a Broken Clock – Tuesday, Dec. 8, 2009.
by gmak
When a market is tired, it doesn’t take much to push it over. Even though Dubai is “old news”, little reminders that there are zombies walking around keep creeping into the MSM stream. Nakhel (Dubai) has a first-half loss fo $3.65 bb. HRB marches on (my sympathies to all those who have been pounding the table about it being a POS for 3 years). A survey shows that many (clearly not understanding the question from the video) would support a move to create hyperinflation. The US consumer has not paid off as much debt as previously thought – could it have something to do with the holidays (as usual) – just one more time to get that 100 foot plasma tv, I guess. There are signs of so-called economic growth around the world, and yet the risk trade is off today. Welcome to the broken clock.
EQUITY
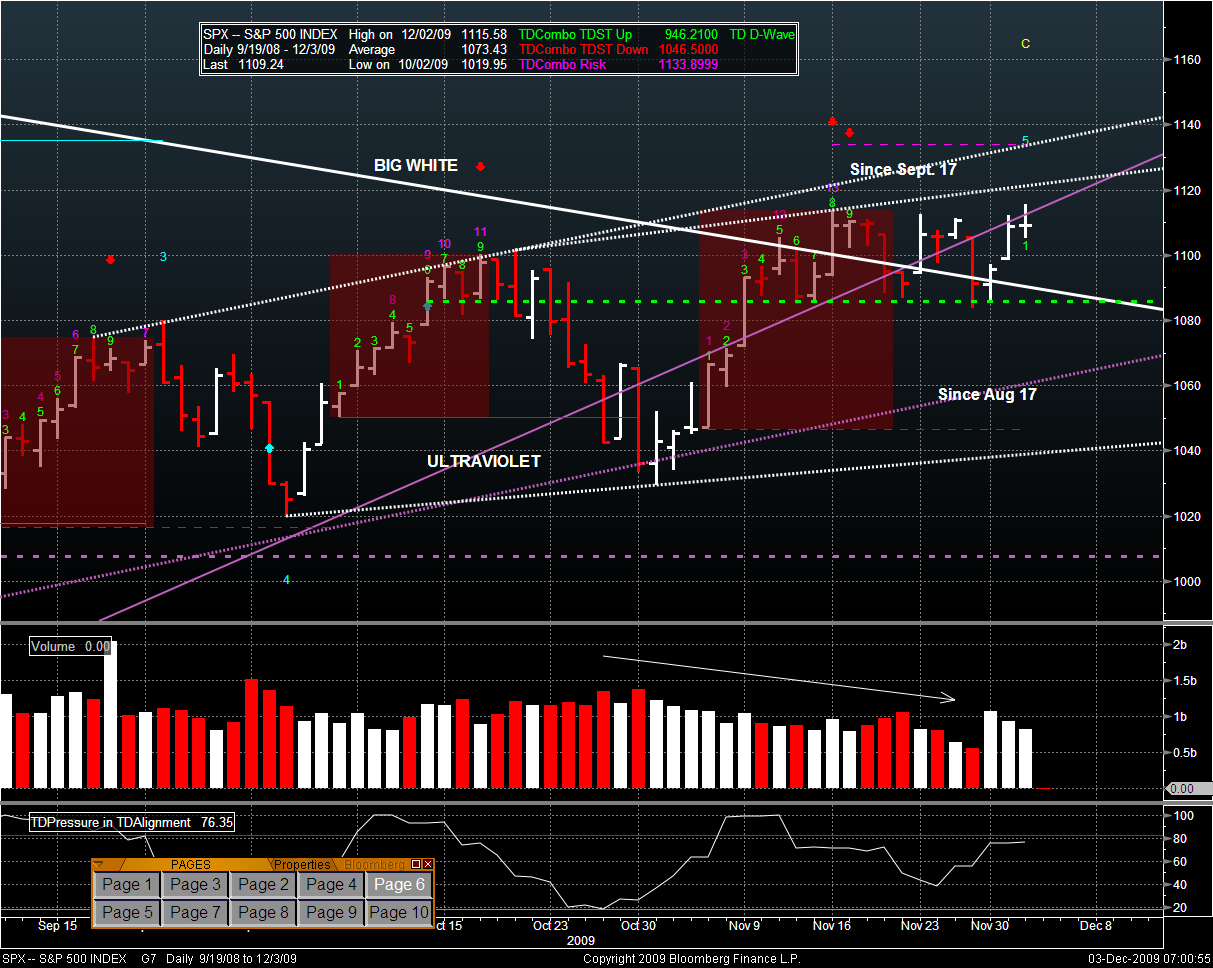
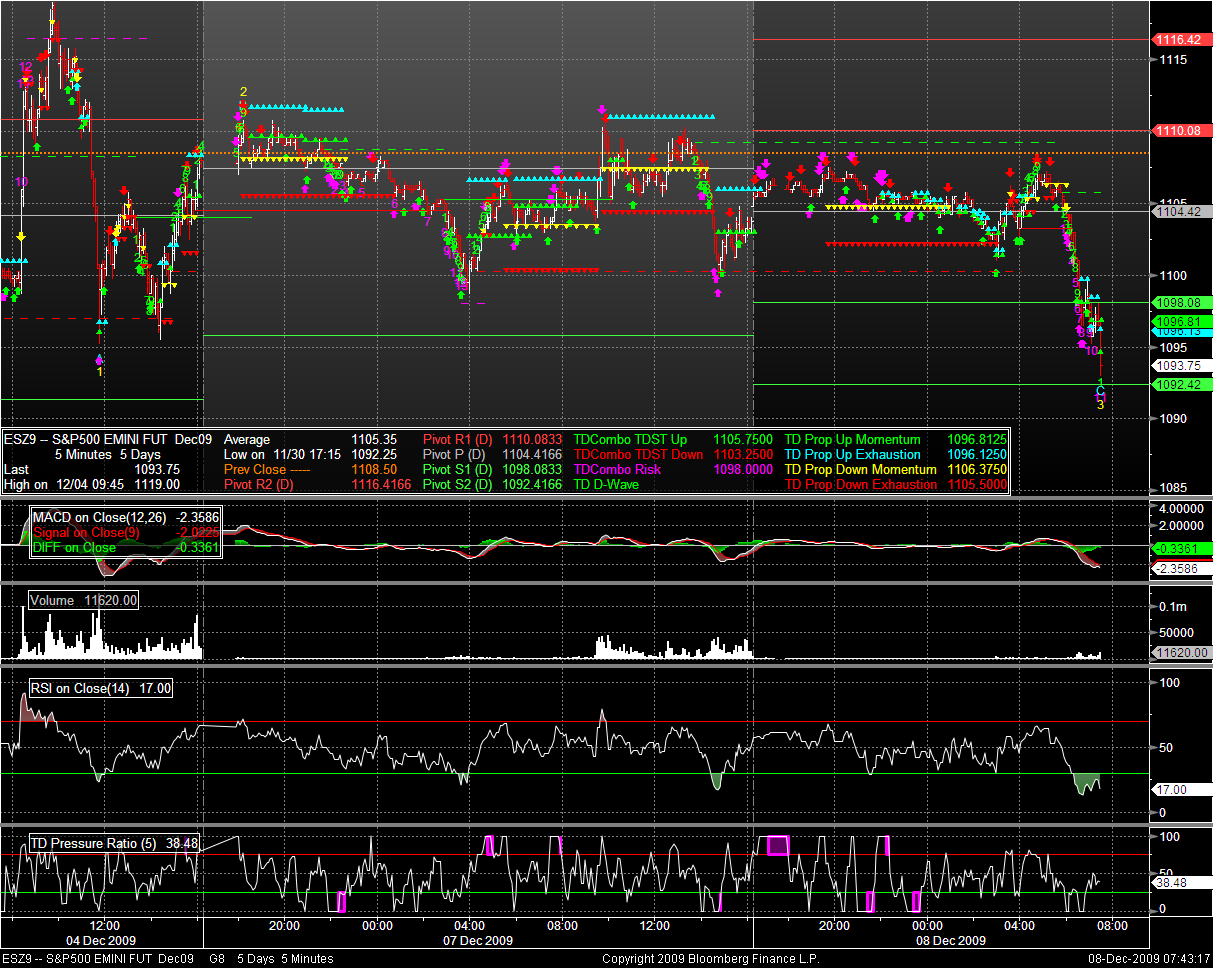
Wasn’t yesterday interesting in the way that the bid just seemed to fade into the shadows in the afternoon? FUnny how the bears have become so gun shy that a 3 point loss (more or less) is seen as a possible start to victory. The daily chart clearly shows SPX hanging in the ether with no clear direction. Yesterday was RED, but volume was down. SPX is still a ways away from ULTRAVIOLET trend line, and from the dashed green apparent support line. Looks like intermediate support at 1100, for now.
The world is pretty much red, and a look at the DAX shows that, though support has been broken, there is still a ways to go until the trend can be said to have reversed. Looks like solid support at 5620 – just like SPX seems to have solid support at around 1086. For the DAX, ony the industrials are showing some green and that sector is turning red as I type.
ES fell off a cliff starting around 6 AM EST – just like the DAX. German Industrial Production came out red and below expectations at that time. ES even blew through the pivot at 1098 and is coming back up to test it. In TA terms, one would expect a drop off after the re-test. Volume was quite strong (for this early time) on the waterfall from 6AM. Pivots:
- R2: 1116.50 = TD TA says that there are likely sellers waiting around that level after being stranded by the ramp and drop on Friday.
- R1: 1110 = around the peak from yesterday afternoon and also resistance level from Sunday o/n
- Neutral : 1104.50 = probably not as meaningful a resistance level as the TD risk level at 1105.75 where buyers were trapped when the waterfall began at 6AM.
- S1: 1098 = acting like a roof right now. Plus there is a TD resistance level just above for price exhaustion, if ever te pivot is broken.
- S2: 1092.50 = Has been the area of many buy /sell battles over the last 20 trading days. Sometimes roof, sometimes floor. ES seems to always move over it with impunity – but keeps coming back to that level, whatever the direction.
FX
USD is stronger, so is JPY. This is usually a sign that the flight-to-safety trade is on. Risk assets such as equities are being sold. GOLD is behaving badly – unable to decide if it is an inflation hedge or comfort in times of crisis. CAD, EUR, and GBP ar all weaker – with GBP down more than a cent. Flight from risk, indeed.
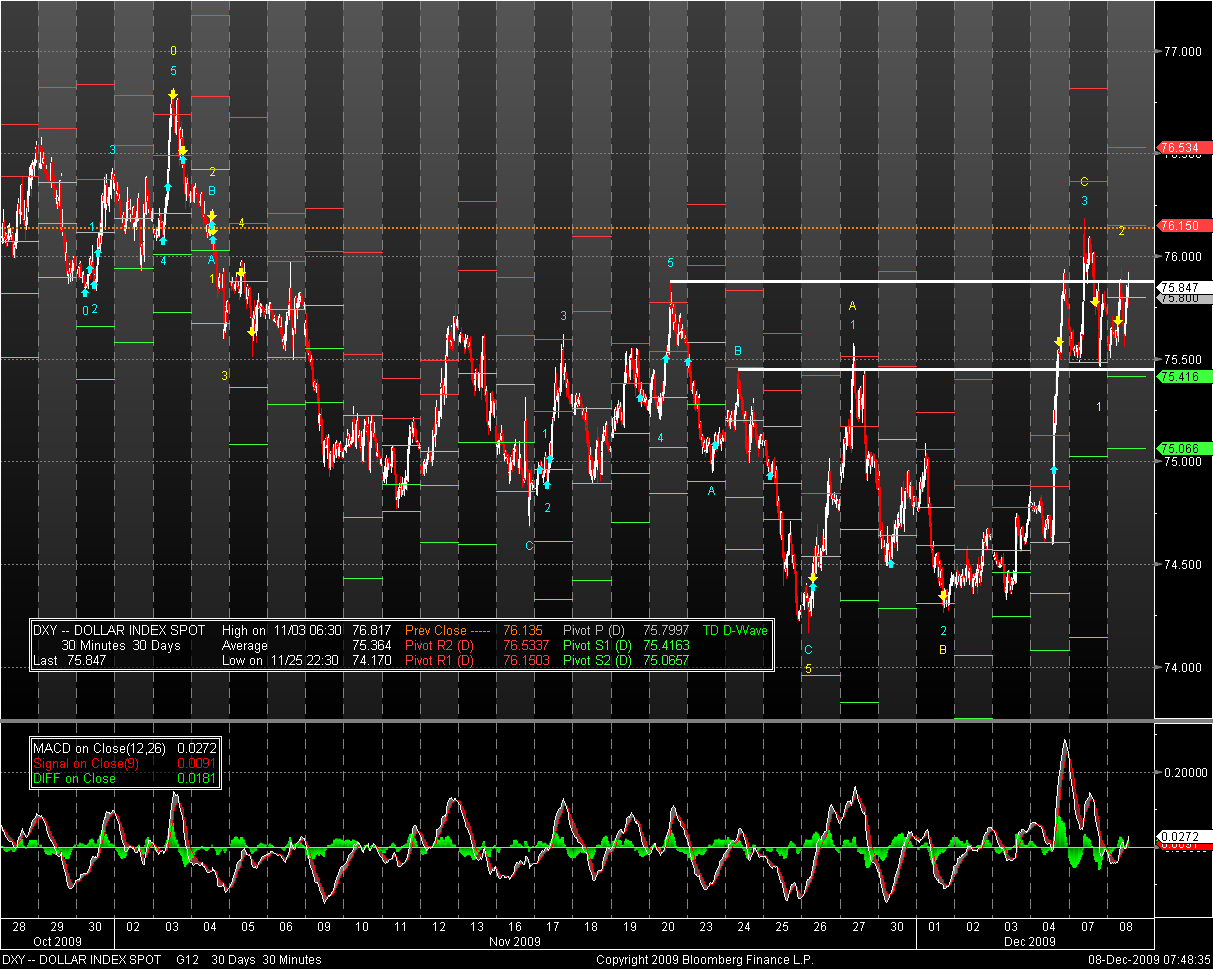
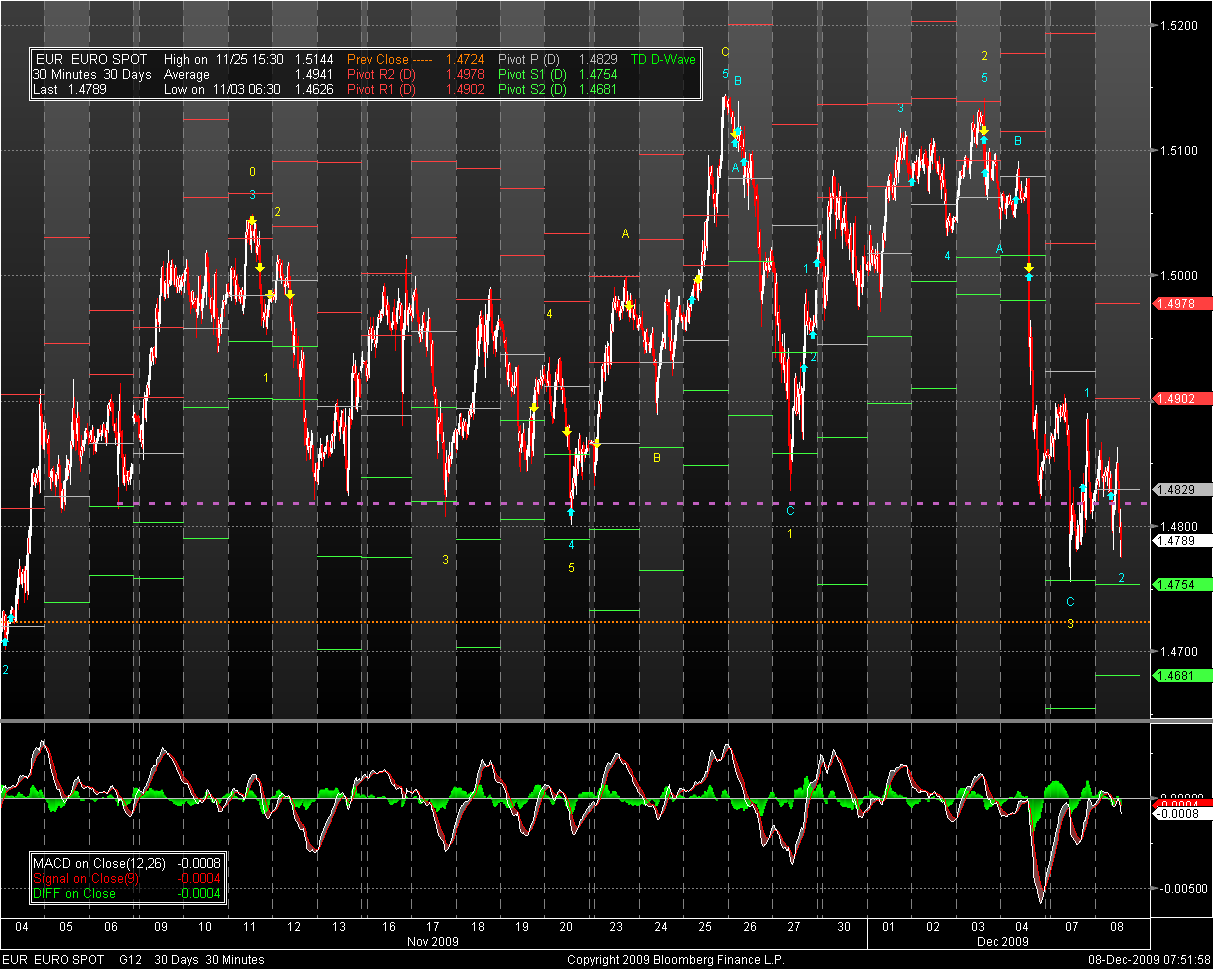
DXY is making a second attempt to get above the “next-in-line” high – which is the higher horizontal white line on the chart. The EUR is about 50% of the DXY (more or less). Until this point is cleared ( and DXY gets solidly above tht orange dotted line at 76.15 – which is the close from Oct 27 = the day before the chart begins). THe EUR shows that it is flirting with the purple dashed support line that I drew, connecting the bottoms of many days over the last month or so. It is in TD wave 4 of 5 (down), so there will be some sideways consolidation before the next leg down – if it’s coming.
NEWS
You can read as well as I can.
DATA
Ditto: (Small business optimism is down to 88.3 from 89.1 prior. <shrug> Today is all about perceptions of confidence. Thursday is the better data.

The BIS reports that outstanding OTC derivative contracts were up 10.5% in the first half of 2009. Plus que ca change…… and “Apres moi, le deluge”. The more things change….. and “Here comes the flood”.
http://www.youtube.com/watch?v=Ww9JS8dJ9fY
Isn’t music so much better now that the creators are getting old and worried about their hearing?
Cheers.


