


Living Inside a Broken Clock: Tuesday, Jan. 12, 2010.
Living Inside a Broken Clock: Tuesday, Jan. 12, 2010.
by gmak
Please check out the previous post by Mole (in a rare appearance straight from Las Vegas!) relating to the VIX REVERSAL (yum!).
There are a million reasons to for this market to tank, and only one for it to go up. Guess which one wins for now?
Tick. Financial Institutions are rushing to push their faces into the public trough and become Primary Dealers. Tock. Cuomo is trying to fan the flames of public anger with Wall Street rewarding themselves with record bonuses from the public purse. Forest fires are easier to start than to put out. Tick. Banks are falling over themselves to get paid zero interest in short-term Tbills. Tock. Households are reducing debt instead of consuming. Tick. US Mortgage Delinquencies EXCLUDING FORECLOSURES have reached 9.8%. Tock. The US has enormous short term maturities of Tbills that must be rolled over with the support of foreign, and sometimes hostile, nations. Tick. The 2y /20y spread hit 380 bps – the widest spread ever. The FED is trying really hard to encourage consumption and bank lending. Tock. There is scant economic data to support this steep upward slope on the yield curve. Tick. You just know that there is a nasty accident already happening inside the financial system and the cockroaches are scurrying to distract the public gaze from what it is. Tock. Welcome to the broken clock.
Watch Chavez, what he tries in Venezela, and what happens to the country. If the FED is successful with the reflation game on the USD, it will be repeated elsewhere and it could happen here. Something similar happened in th ’70s as a result of Johnson’s “Great Society”, and Nixon and the Vietnam war. Trudeau and Nixon both tried wage and price controls – to no avail. It just led to shortages.
EQUITY
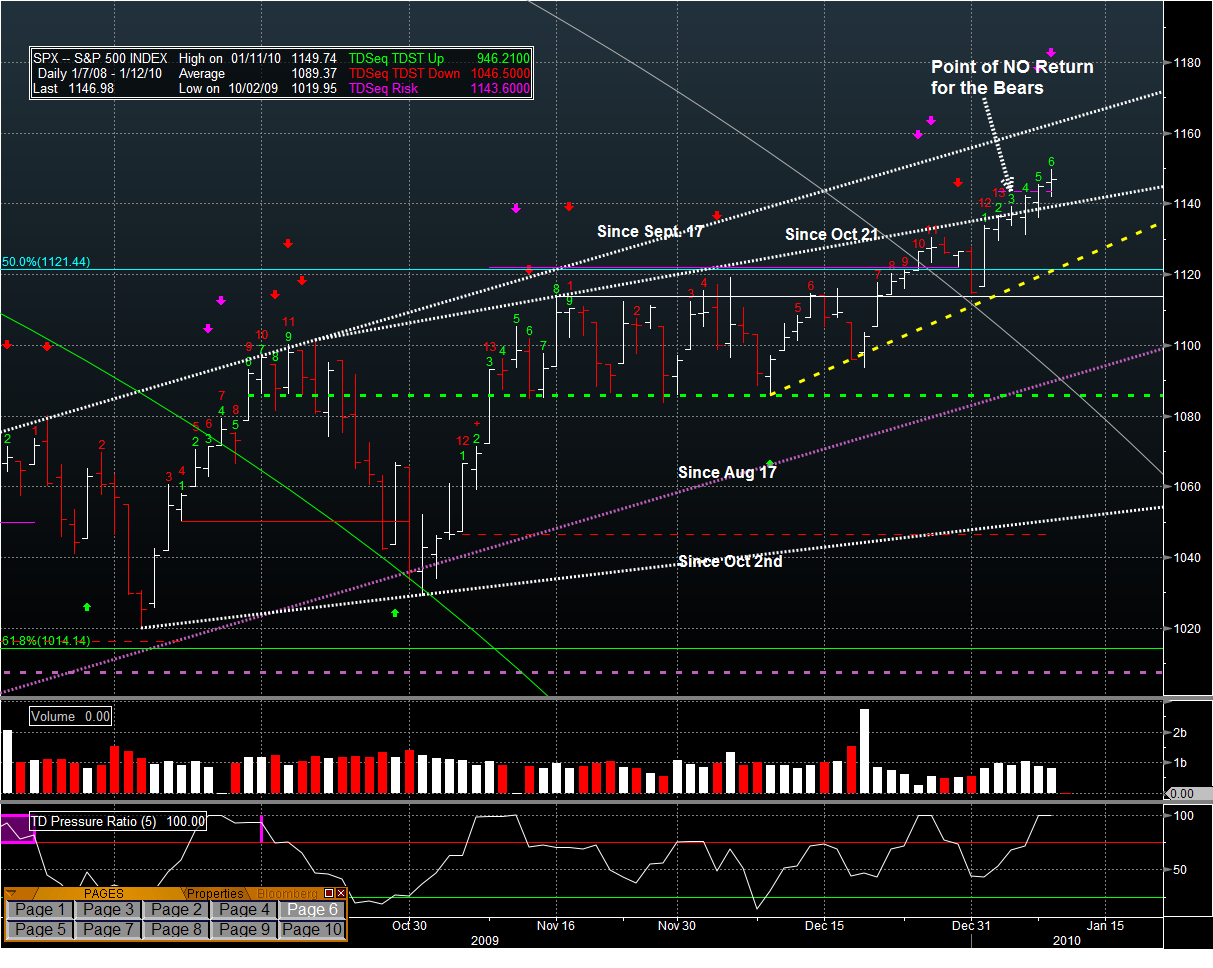
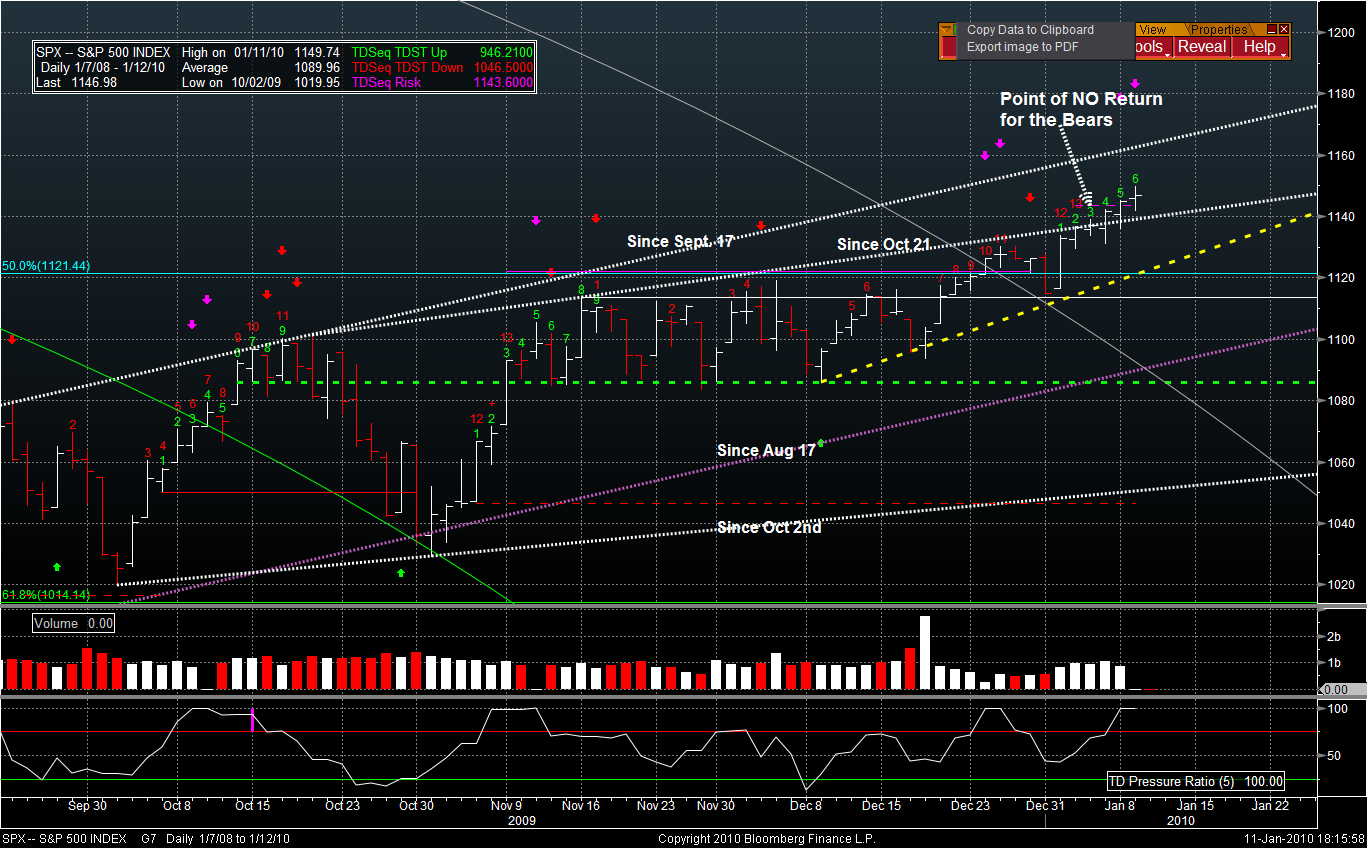
SPX opened higher and closed higher still above a TD risk line. The TA says that this trend will continue at least for 3 more days, followed by a reflex pullback. IF we are following classic TA, the pullback will be to the “Since Oct 21” trend line, which would be used as a launching pad for one last bid to convince the retail bid to come into the equity market. -OR- SPX rises to test the “Since Sept 17” trend line before coming back dow to the “Since Aug 17” trend line – which looks like a channel that has been running for several months. -OR- This is just an overthrow, and SPX begins to head down to test the dashed green line at 1086, followed by a drop to the “Since Oct 2nd” trend line. One can make a case for almost any scenario – and support it well with Technical Analysis. The best thing to do is to swim with the current with smart entry points and insightful stop-loss triggers.
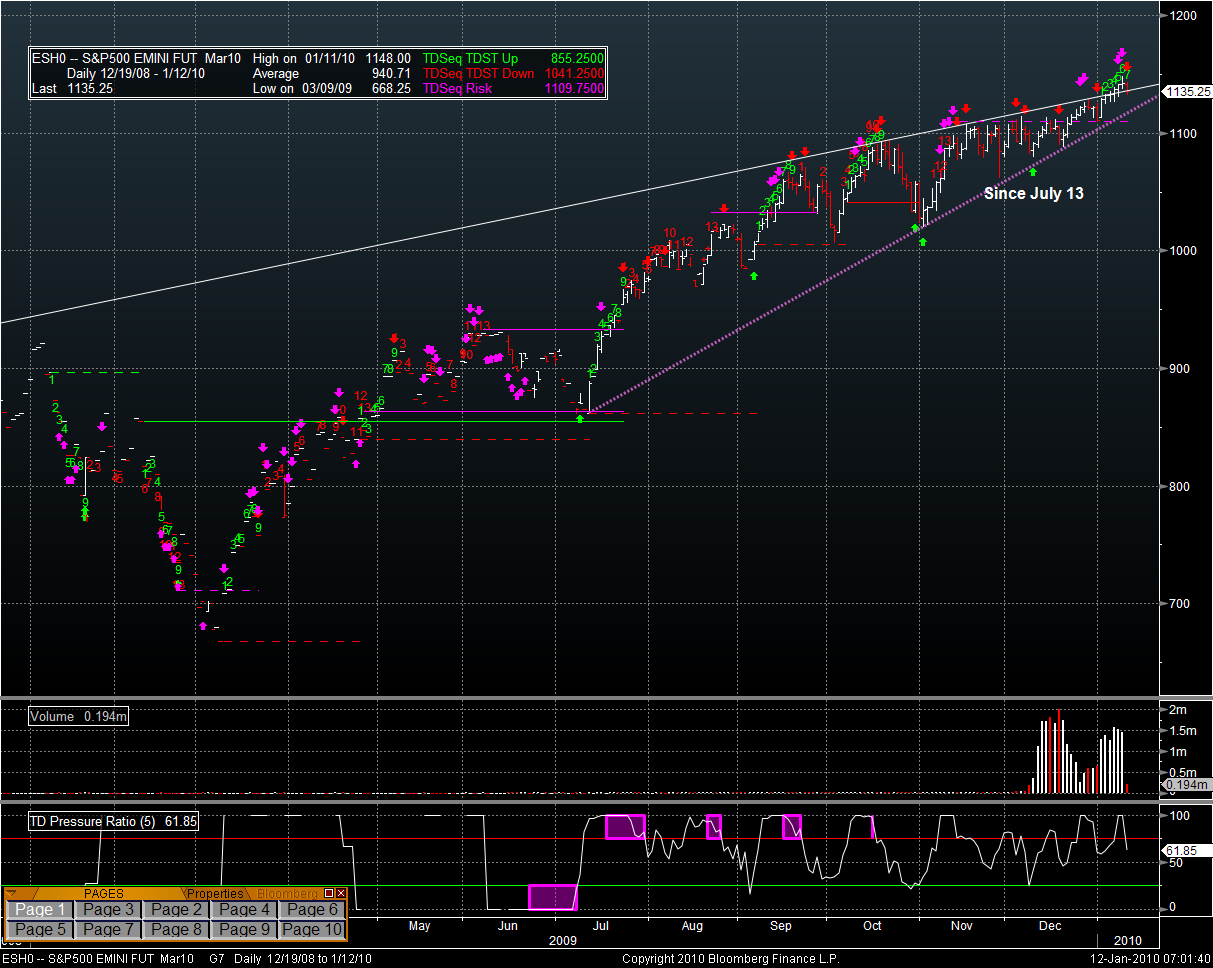
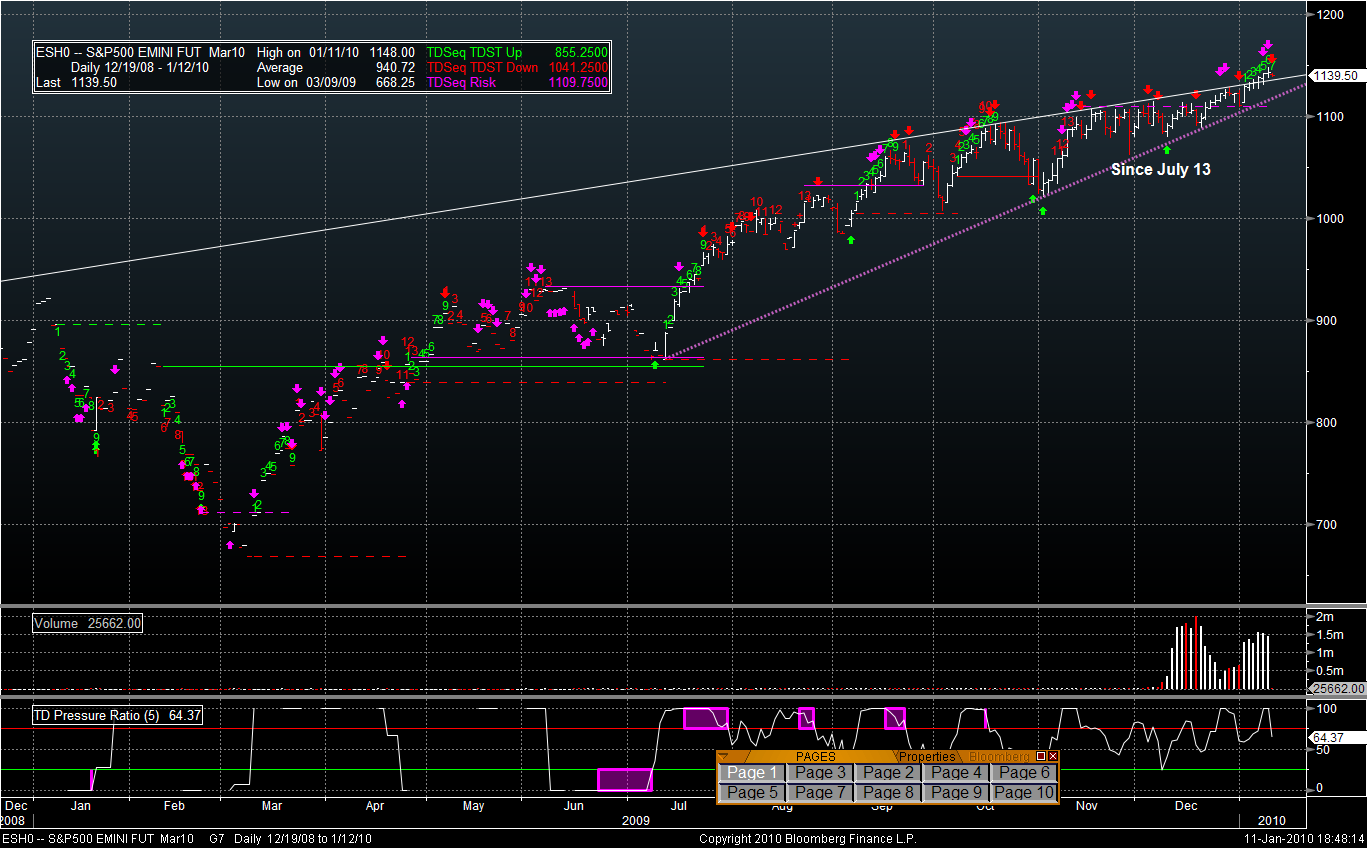
The ES daily chart shows another view of the current situation. It is either an overthrow of the wedge, or a clean break up. The red bar, so far this AM is suggesting an overthrow. I would not play this market more than intra-day, at this stage. And the action is definitely theta-burning on options.
I’m still constrained in what I can copy off of Bloomberg. Hopefully the situation will get resolved today. Asia was mixed. Europe is red by about a percent. China did move to increase Bank’s reserve requirements which is pressuring the EUR.
The DAX opened around yesterday’s close but has been weak after an initial attempt to move off of the lows. Utilities and Consumer Discretionary are among the weker sectors, along with Financials and Materials. Boy, the economy 6 months from now is going to be a yo-yo day-to-day, no? heh.
ES bounced around all night, constraied between two pivots. It sold off into the Europe open and then dropped straight down (about 5 points) in 5 minutes and is presently forming a bearish flag on that 5 min chart. The only reason that I can see for the weakness is the news about China – and some insinuations about rate increases over there. Pivots:
- R2: 1153 = Would be a new high. Given the threat of less liquidity and higher interest rates, I think that this is on hold for now.
- R1: 1147.75 = Ditto
- Neutral: 1142.75 = Kept ES down all night
- S1: 1137.50 = Was the floor until the China news hit.
- S2: 1132 = Hasn’t been touched yet, but was the source of support on last Friday that led to the strong move up during the day and Sunday overnight.

I would only go short if the S2 pivot is broken at 1132.50; This looks like a good place for a long with a stop just the other side of the pivot, and then double down if the move south starts to shift from 1 unit long to 1 unit short – if you are so inclined.
FX
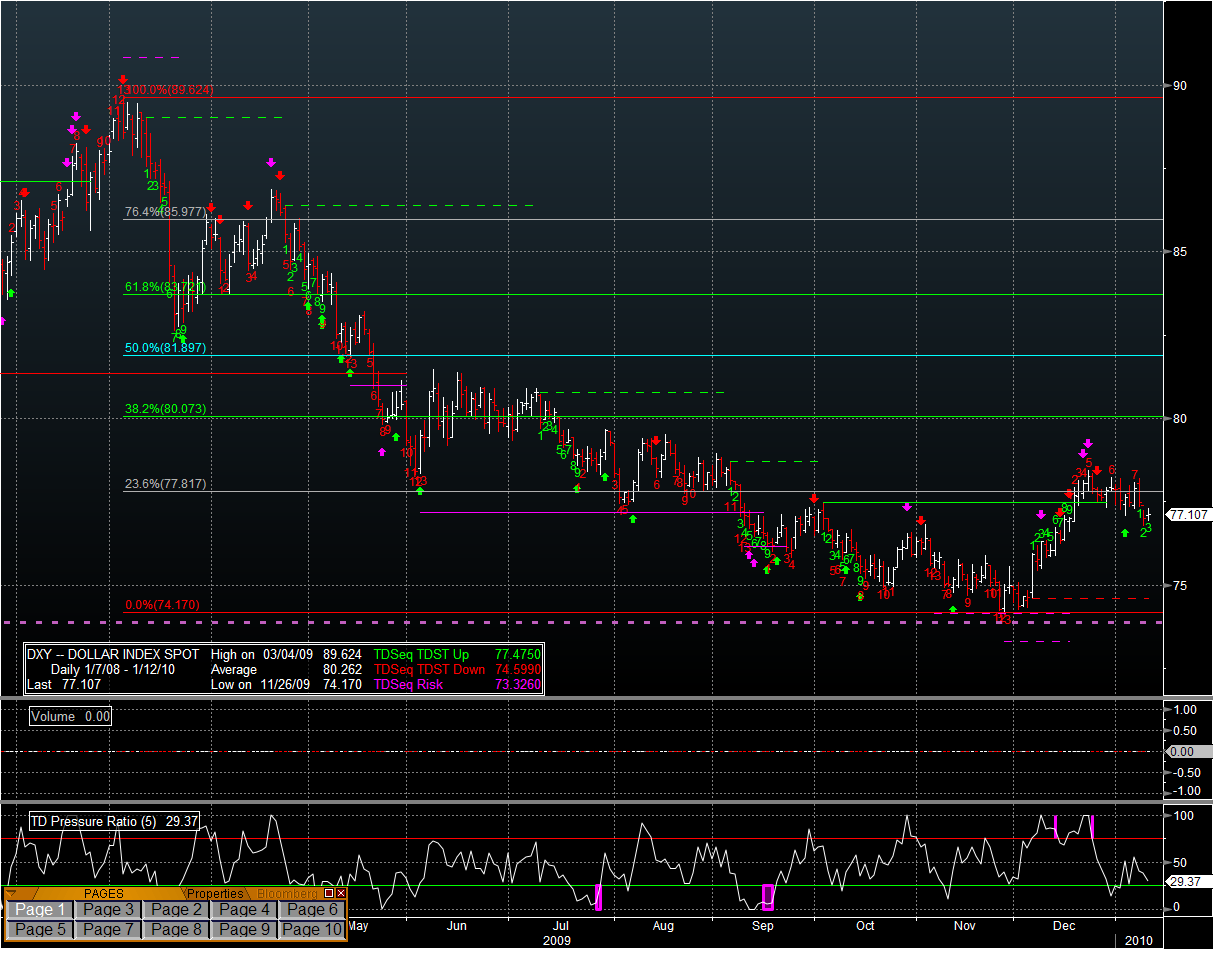
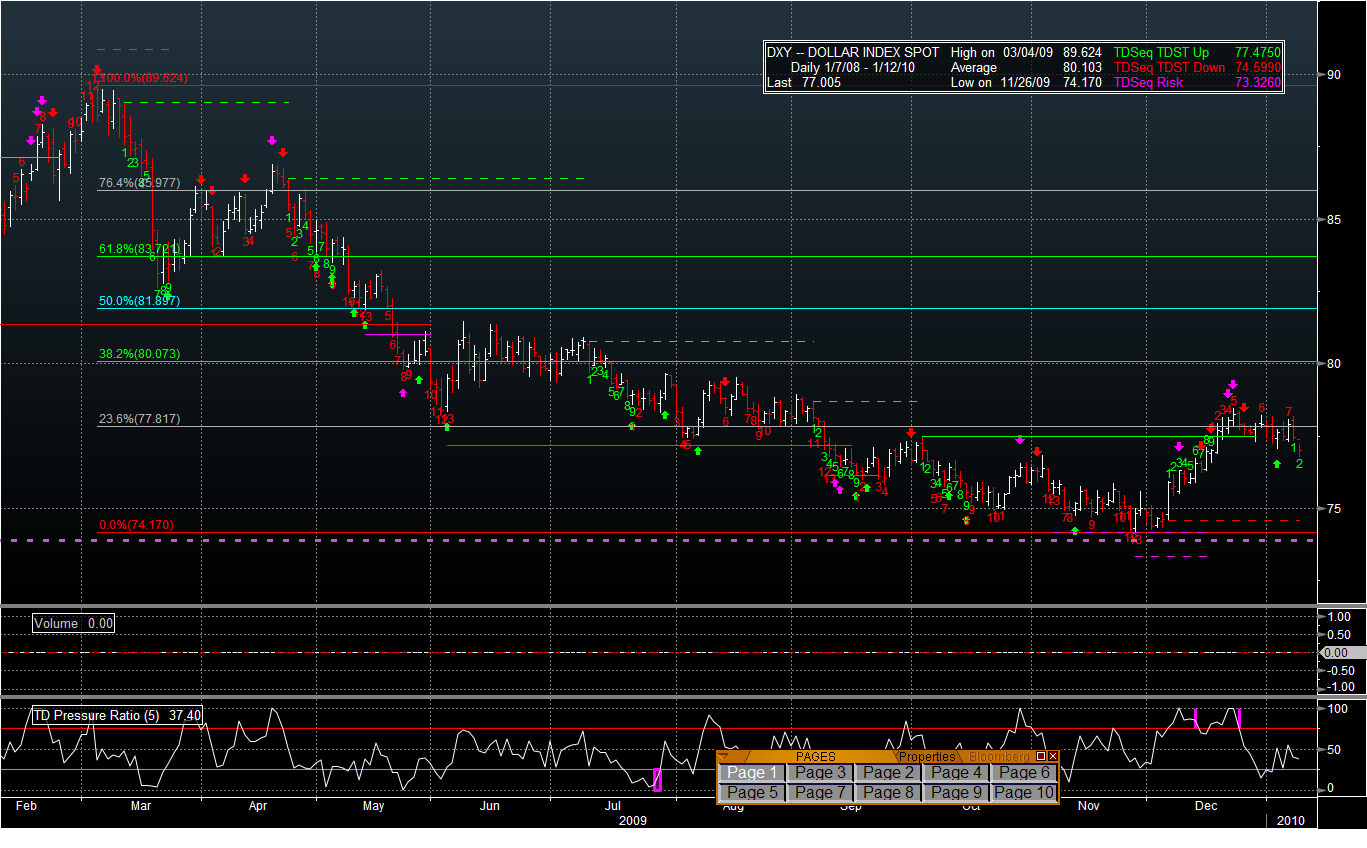
I do not like this chart of DXY. It has 74.50 written all over it, with 70 as a possible next stop. I believe that the carry trade took a small break up to here, but is making a come back.
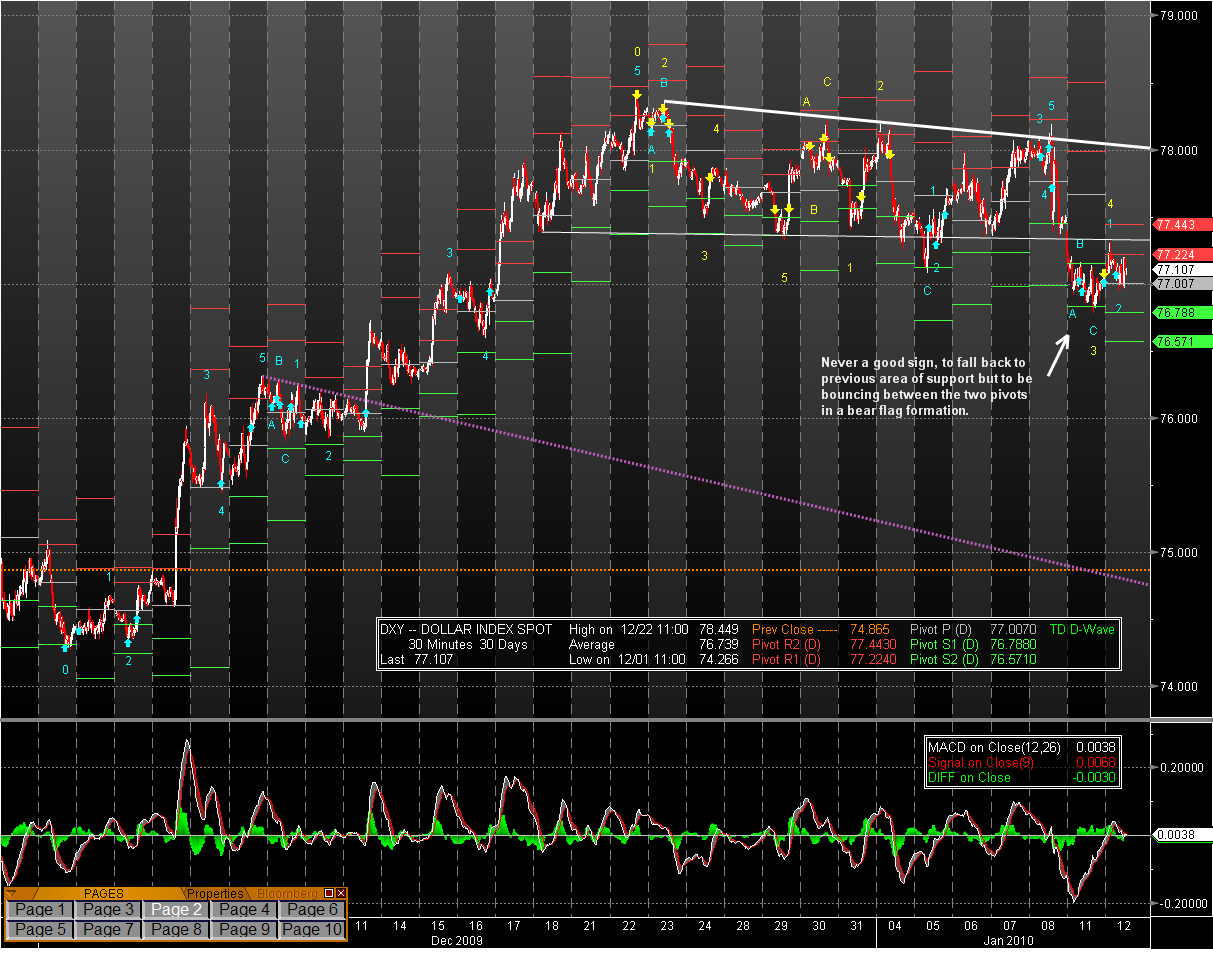
The 30 min chart is even scarier.
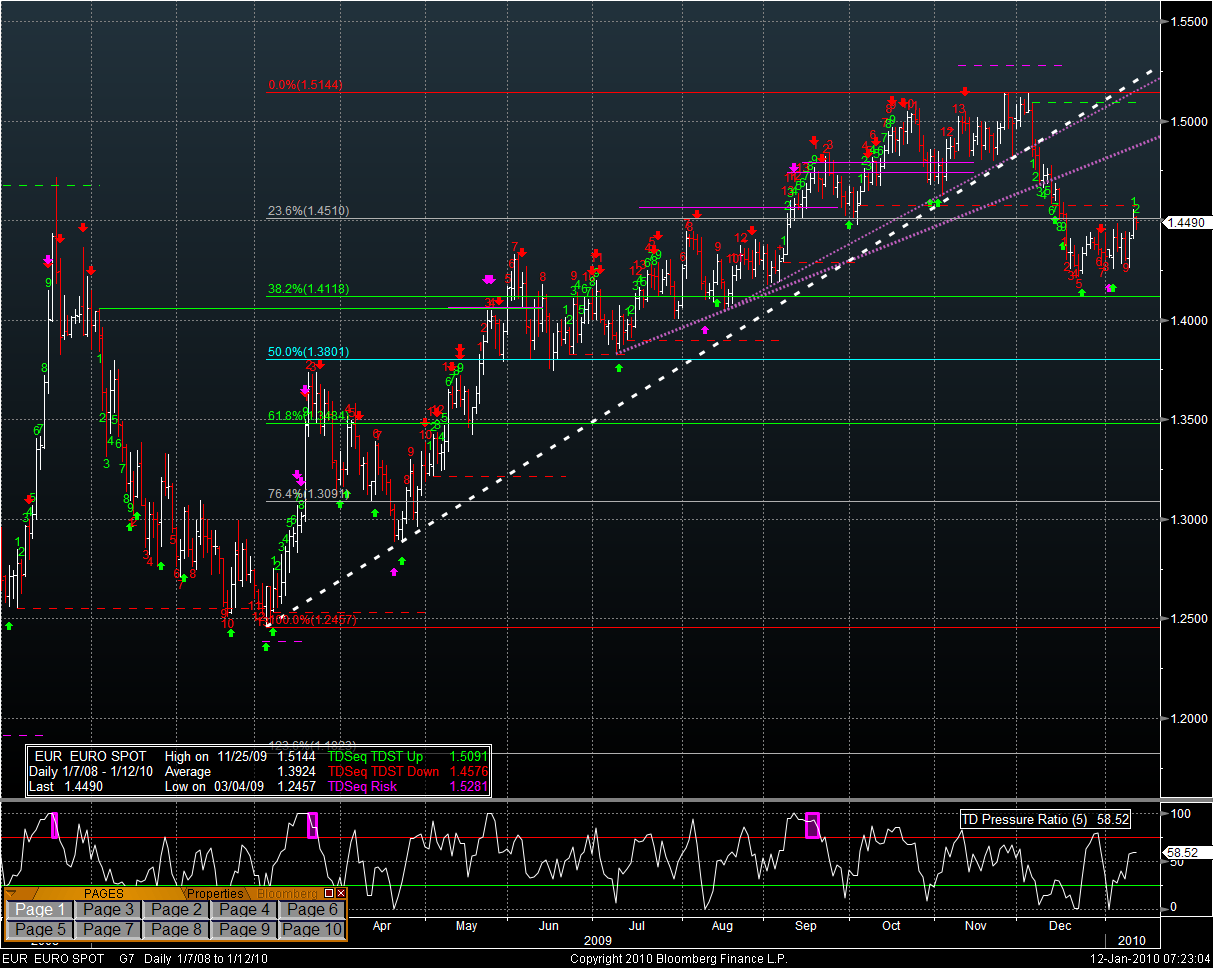
The only grain of hope for USD bulls is that the EUR attempted a break out, and has been rebuffed so far.
So far today, the USD is somewhat stronger – but starting to cool off. The CAD is flat. The Yen is stronger along with GBP. The EUR is weaker. Your guess is as good as mine. It looks like a move away from the growth /risk trade (look at the price of oil) along with some local macro speculation.
NEWS
- China moves to increase reserve requirements for banks, and intimates at higher rates. This could cool the economy – and the latest mini-rally in SPX is based on the China growth story (exports and imports up).
- Obama is going to charge fees to banks to help curtail the deficit. Guess who’s pocket the hand will really be in – ours.
- India’s industrial production rose the most in 25 months.
DATA
Nothing market moving, IMHO.
- 7:30 = NFIB small business opinion.
- 8:30 = Trade balance
- 10:00 = IBD/TIPP Economic Optimism
- 17:00 = ABC Consumer Confidence
I hope that today is a profitable one.
Cheers.
Here is Mole’s post in case it is too difficult to go back and read it.
VIX Reversal Signal – Day One
Yes, I’m back – but my time is extremely limited right now – so without further ado I will present my case. Something very rare occurred today – an event that has not occurred for several months now:
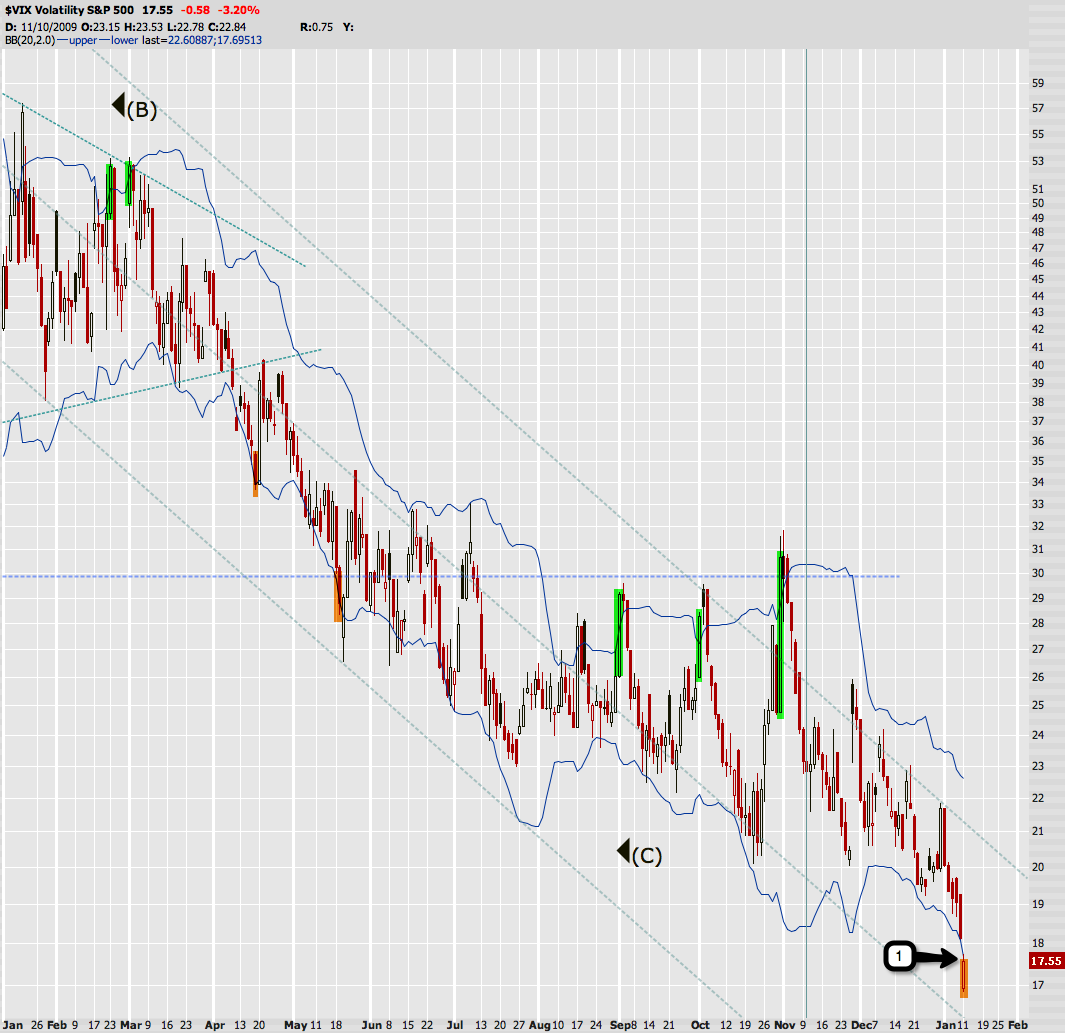
Today represents step 1 in a technical pattern called a VIX reversal signal. To illustrate the pattern I have marked the sell signals in orange and the buy signals in green on the chart above. Since last summer we mainly saw VIX buy reversal signals – all of them concluded successfully. A VIX buy reversal is of course the inverse of a VIX sell reversal signal. The last time we got the former was on October 30th, at which time a certain analyst I won’t name here recommended to more or less ignore it as the market was supposed to continue downwards. I think this is one ignominious call he’ll have to live with as the ensuing bear squeeze wiped out a lot of his bearish followers.
For the noobs – here are the rules:
For a $VIX confirmed signal you need 3 events:
- A close outside of the 2.0 Bollinger Band (20-day SMA)
- A close back inside the 2.0 BB – this issues the signal
- A higher close (sell) or lower close (buy) than the close of the day back inside the 2.0 BB – this confirms the signal.
Once you get those 3 events a major reversal usually occurs within the next week. The sell signals are far more accurate than the buy signals.
Yes, that last sentence should make any bear hopeful – but it’s been the other way around in the past few months and that’s the reason I only loaded up on a very moderate amount of index puts right before the closing bell. Of course technically speaking I should wait until the confirmation, which is at least two days away – assuming we get it that is. BTW – why index puts? Only because I didn’t have the time to parse through my overbought filter and pick specific symbols. Well, let’s see what happens tomorrow. A close back inside the 2.0 BB would lead me to increase my positions size.
Understandably many of you are nervous about shorting this market – and rightfully so I might add. You can only get your dick caught in the elevator doors that many times until you start remembering to zip up your pants after taking a leak. But I have a very fundamental rule when it comes to trading. If I encounter a time tested technical signal that indicates a market reversal is in the making then I have to take it, no matter what. The day my emotions or a directional bias prevents me from following a statistically proven technical trigger is when I must retire from trading.
For what it’s worth: It would be nice to see a down day for a change – this market is getting on my nerves. I suffer from a mental condition that prevents me from doing what everyone else is doing, especially when it comes to trading. In the past few months everyone seems to be doing the same thing over and over again – and it’s working for them. That’s not how it has worked during 99.9% of the stock market’s history.
I’ll leave you with that to chew on.
Mole (some of you might remember me)
P.S.: The Rammstein notification module has now been activated – have fun ![]()


