


Held Together By Duct Tape
Held Together By Duct Tape
We’re approaching the close of our January candle and by any definition it’s been a turbulent month for equities traders. We are all guilty of attempting to paint the future by looking at the past (with mixed results), but this morning’s exercise is to abandon or at least postpone such temptations and to simply look at what IS and then to conclude possible implications:

The chart above features some of the volatility measures I employ, some of you may recognize Ken Long’s VolStat indicator. It provides us with a percentage based measure of average true range which then is put into context by standard deviation bands – you know, just like Bollingers. This tells me what volatility phase we are in and which type of trading strategies may currently be employed most effectively. What it does NOT tell me is the future of state of volatilty – like most indicators it has zero predictive value. Sometimes you get lucky in recognizing a particular formation and perhaps it ends up repeating (sort of).
More recently however I have come back to the basics by employing a simple LogReturn in combination with either a Bollinger or a Keltner channel for additional context. LogReturn is used heavily in machine learning as it relativizes price in the context of yesterday’s position. In other words – we want to know the delta between today’s and yesterday’s close. This offers us a pretty bare bones measure of price changes independent of the underlying’s nominal value. The formula is pretty trivial actually – first you calculate rate of return:
R = Close[0] / Close[1]
Alternatively you can deduct today’s close from yesterday’s and divide the result by yesterday’s close:
R = Close[0] – Close[1] / Close[1]
You can actually just use that but I prefer to slap a natural log on it, thus it’s a LogReturn:
LR = ln(R)
And that’s it. What we have here now is a pretty basic expression of price movement/momentum. And with that in mind you can start interpreting the lower panel on the chart above quite effectively. What I see is expansion and compression of price volatility. In previous corrections we started seeing long spikes to the downside which at some point where followed by selling exhaustion in turn followed by buying pressure which gradually started to build higher day by day. This is how I would expect a reversal to play out and it looks rather natural.
However in recent weeks the pattern has changed. We are now seeing large sudden spikes to the downside stemming increasing selling pressure. Look at the three spikes I have highlighted – they are pretty forceful and one may interpret them as stick saves to discourage the bears from taking the tape lower. What however the most interesting to me is what we are NOT seeing here: Follow through – the big spikes are not accompanied by lower level buying spikes which would support the notion of increasing buying pressure. They were definitely present in prior corrective moves but at least thus far they seem to be lacking. Rather it looks like the tape is being forcefully pushed higher and then everyone just walks away. This reeks of distribution and even if I’m mistaken on that – tape like this it does not reflect a healthy market.
So the take away message here is that the current rally is still standing on very very wobbly legs and it may fall apart at any moment. This whole market seems like it’s held together by duct tape and the wheels may come off at any moment. That won’t keep me from taking long positions near inflection points and while the odds seem to be in the bull’s favor, but let it be said that we should all be aware what we are dealing with.
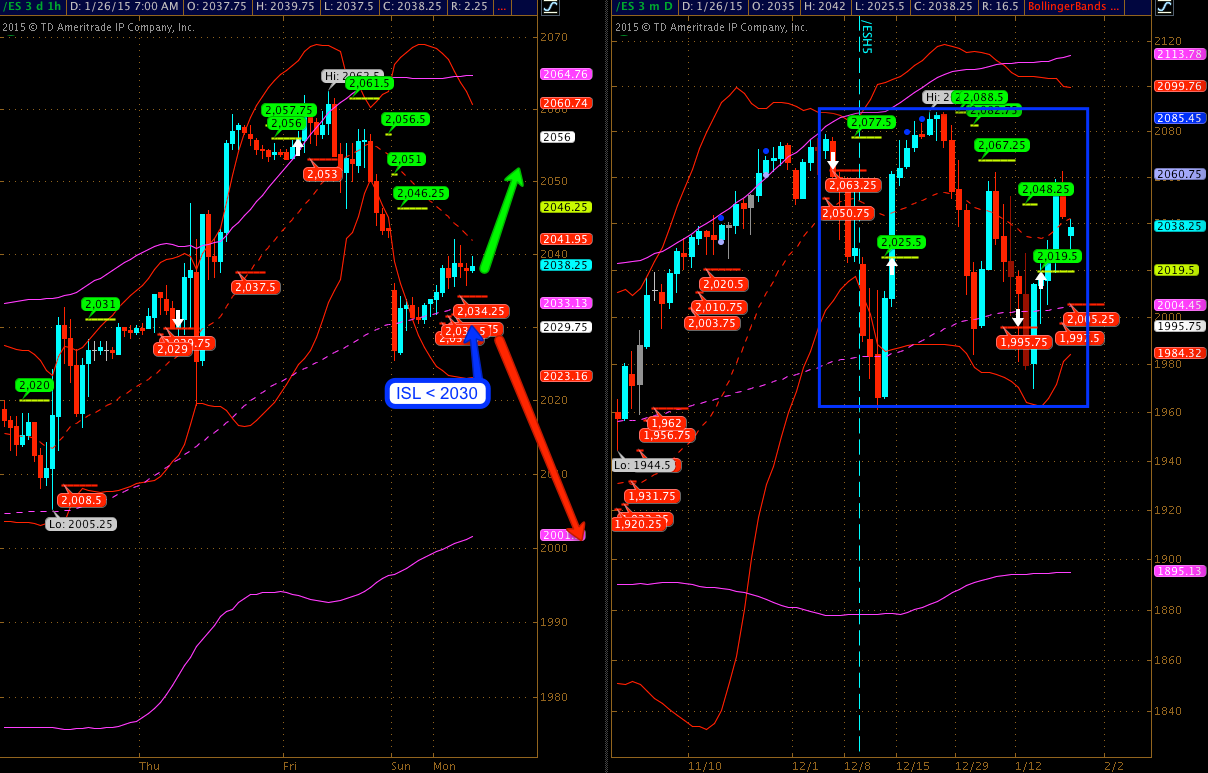
That said – short term the E-Mini is looking like a long with a stop below 2030 – however if breached things may become unglued rather quickly. ES 2014 is where this rally most likely meets is maker. As I said last week – how many more stick saves do the bulls have in them before equities fall off the plate?

The Dollar is getting more volatile as well – I’d be long above the 95.445 NLBL but only 1/2R. My stop would be below 95.16 – pretty nearby. Either it rides higher now or we’re going to see a visit of 94.8.
A few more short term setups below the fold – please join me in the lair:

It's not too late - learn how to consistently trade without worrying about the news, the clickbait, the daily drama and misinformation. If you are interested in becoming a subscriber then don't waste time and sign up here. The Zero indicator service also offers access to all Gold posts, so you actually get double the bang for your buck.
Please login or subscribe here to see the remainder of this post.
You have been briefed – now have fun but keep it frosty. See you guys later this afternoon.
Cheers,


