


Massive Momo Update
Massive Momo Update
No matter if you are a hard nosed trader or a casual investor, every once in a while it’s advisable to detach yourself from the daily grind, sit back, grab a hot beverage, and parse through some long term charts. Although the don’t affect our daily entries here at Evil Speculator, they do give us a better view of what type of market we are navigating and thus how we may have to adjust our trading patterns. After all – context is everything. What may have worked very well in 2012 most likely hasn’t worked in the past year or so. When markets change traders have to change with it or find themselves on an extended losing streak.
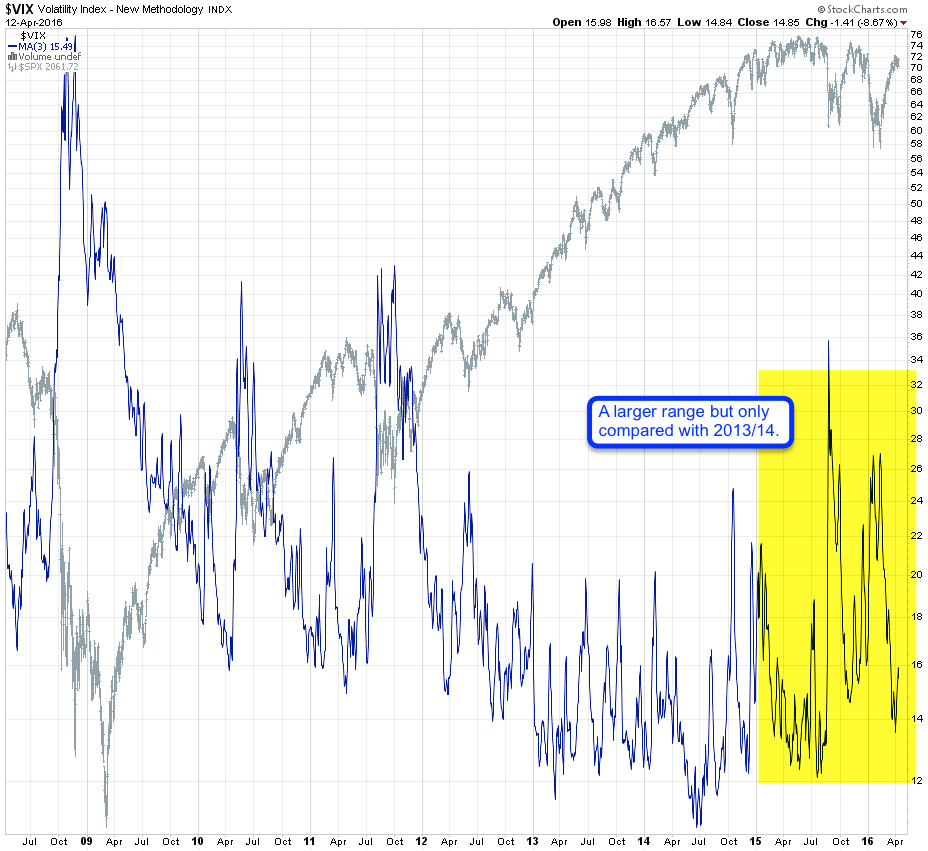
I have been talking quite a bit about volatility as of late, the research of which has become a personal past time or even fascination of mine. So not surprisingly I will start our little journey with implied volatility which most commonly is expressed by the VIX. The first thing that really should be appreciated is the fact that we experiencing more volatility of volatility. Yes, you read that correctly – actually what I should have said is that realized volatility (i.e. amplitude) of implied volatility is on the increase.
If you compare the past few years the only comparable years are 2010 into 2011. Starting 2013 IV consistently dropped and then formed a very clean baseline throughout 2013 between 12 and 20. For the bulls that year was tantamount to manna from heaven. A smooth casual advance only interrupted by a few shallow medium term corrections. Now if you compare that with 2014 then you see seeing the first big August scare which level the playing field for a pretty frustrating market phase all through 2015. What is interesting is that the big IV spike in 2015 was not exceeded by the one accompanying a very comparable correction early this year. To start with I find the timing of that one rather interesting, but it seems that market participants are now relying on the Fed to carry them through yet another year of appreciation in equities. Well, we shall see – let’s look at a few more charts…
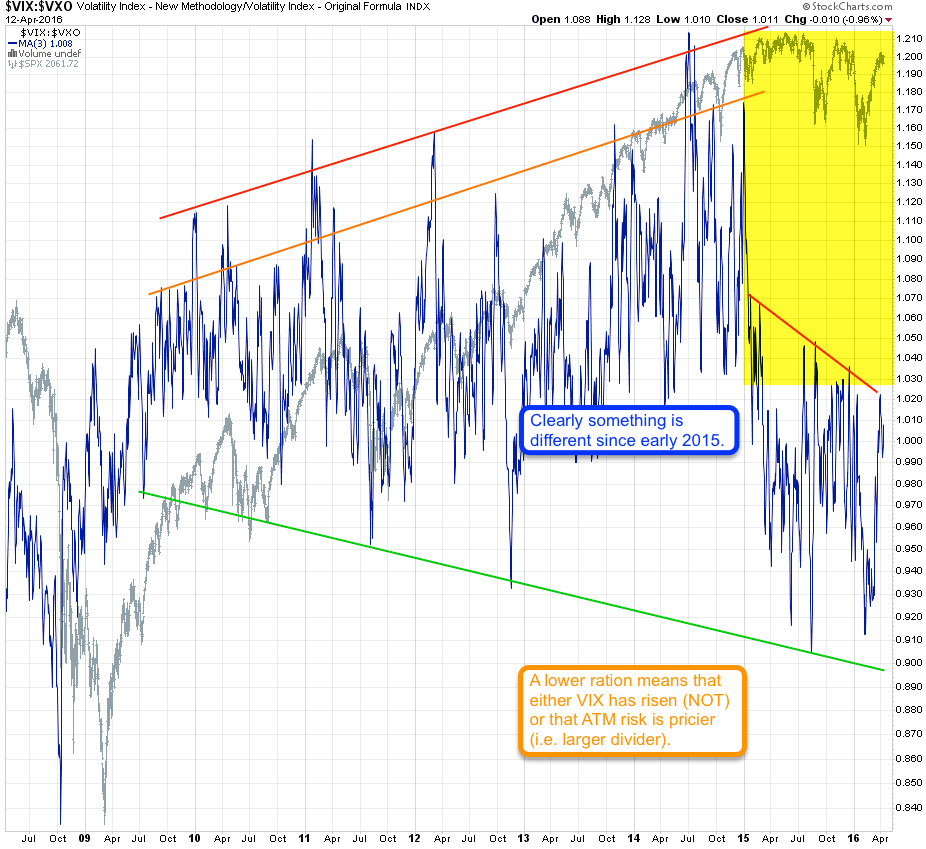
You may remember the VIX:VXO chart which I have been following with interest over the past few years. If you’re new here: we are comparing 30-day IV across the option chain (ITM and OTM) with that of only ATM and NTM. In other words we want to know the ratio between option pricing near or at the money in comparison with the average of the entire option chain. The reason we do that is to figure out if near term risk is perceived as being higher. If so then we know that market makers who price risk are anticipating more short term downside potential.
Once again I have highlighted the 2015 period into today. And quite clearly something has changed here. The entire range seems to have taken a step down. There are only two ways how the entire ratio range could do that – either the VIX has risen significantly (well, somewhat but not that excessively) or the VXO has risen or at least risen more than the VIX. 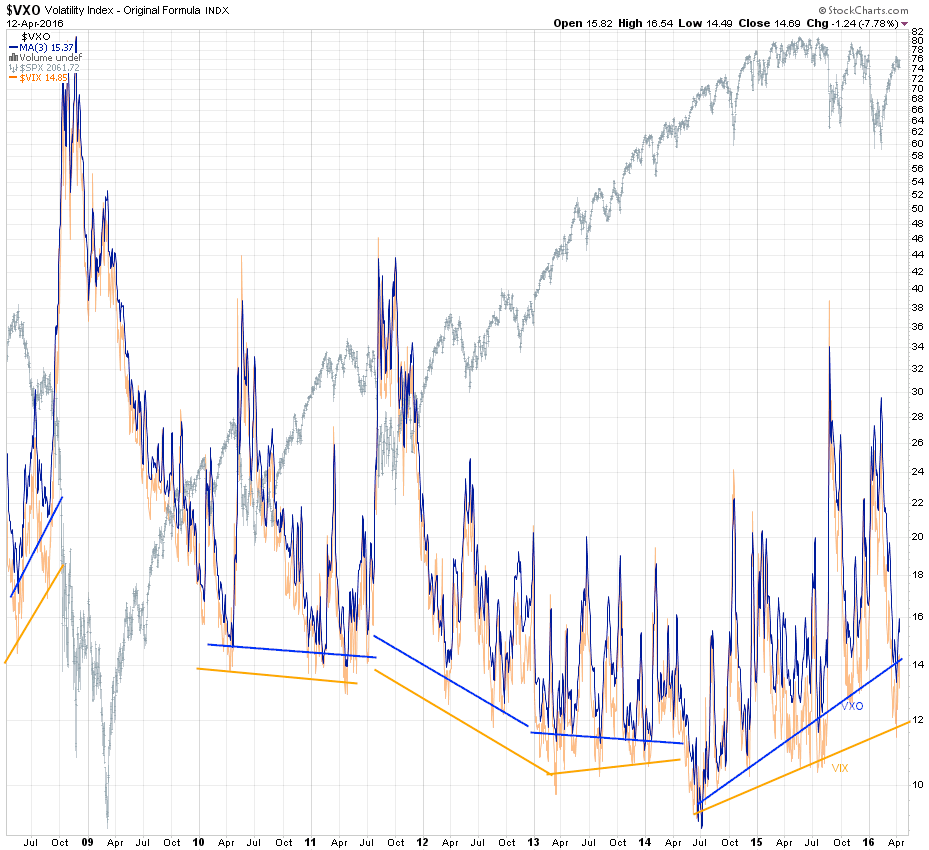
In order to figure out what is what I decided to stack the two on top of each other. And I believe the lines I drew tell the story rather clearly. The VXO (in blue) has a steeper and higher base than the VIX. And that means short term at-the-money (ATM) and near-the-money risk is on the increase.
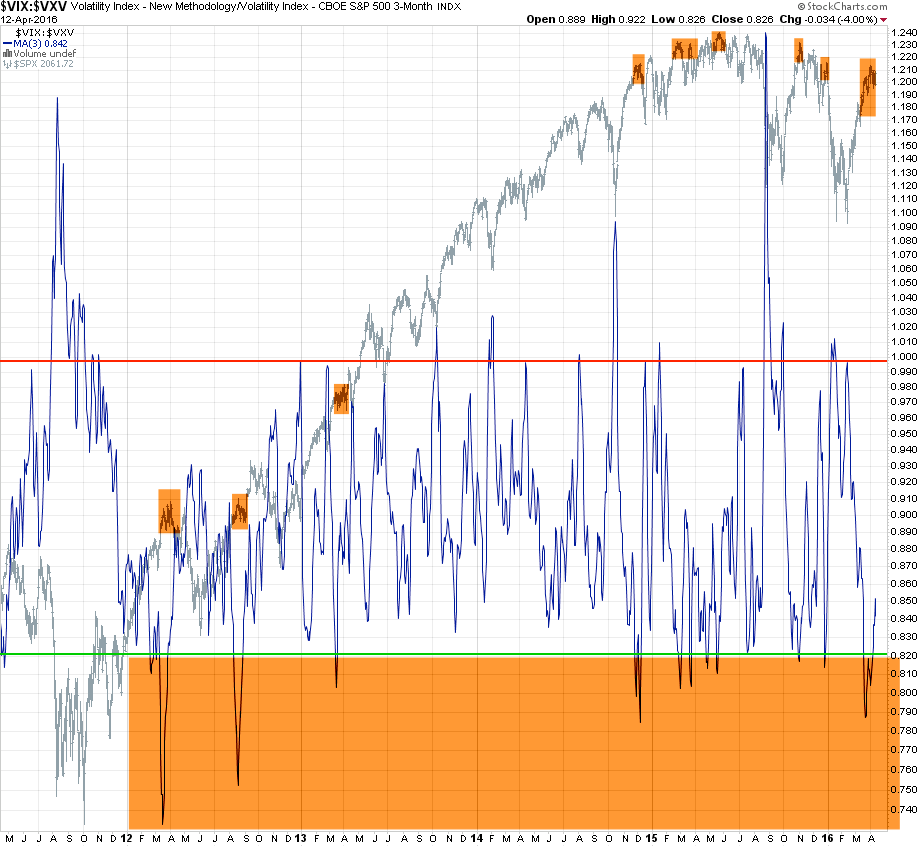
Alright, now let’s visit quarterly IV and compare it with monthly IV: The long spikes that run inverse to the S&P Cash show us bullish reversal points. They were quite a bit more shallow during 2012 and 2013 when the bulls pretty much were running things uncontested. There was a complete absence of any major volatility spikes throughout 2013 until the fall of 2014. The bulls tried to cling to their all time highs but in the end had to give it up in late 2015. No matter how high you fly, gravity in the end always takes care of business.
What is notable right now is that we actually painted another ratio spike down but it was completely ignored. But it’s rather common that VIX:VXV spikes precede market corrections and not accompany them. Remember that implied volatility describes sentiment and risk perception, not risk occurrence.
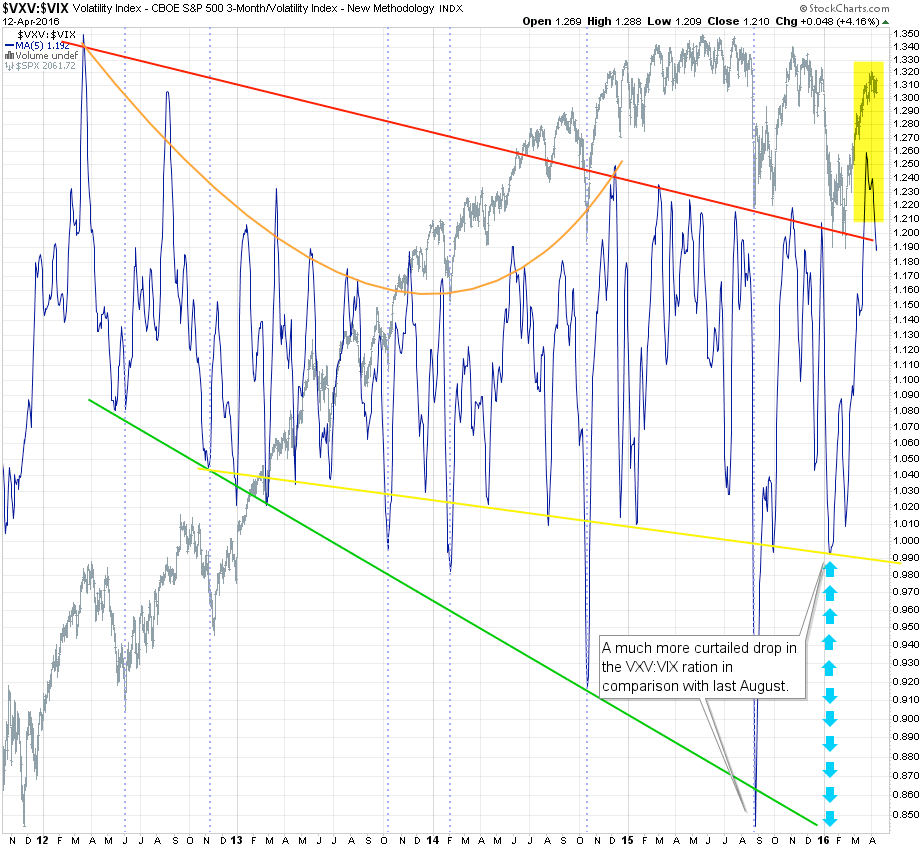
Here’s a second view at the same ratio, only that I flipped it and smoothed it out a little. And the 5-day SMA actually has us at pretty extended readings. So being long here apparently does represent a bit of downside risk. Once again take note of the signal accompanying the medium correction in January of this year. What’s going on there?
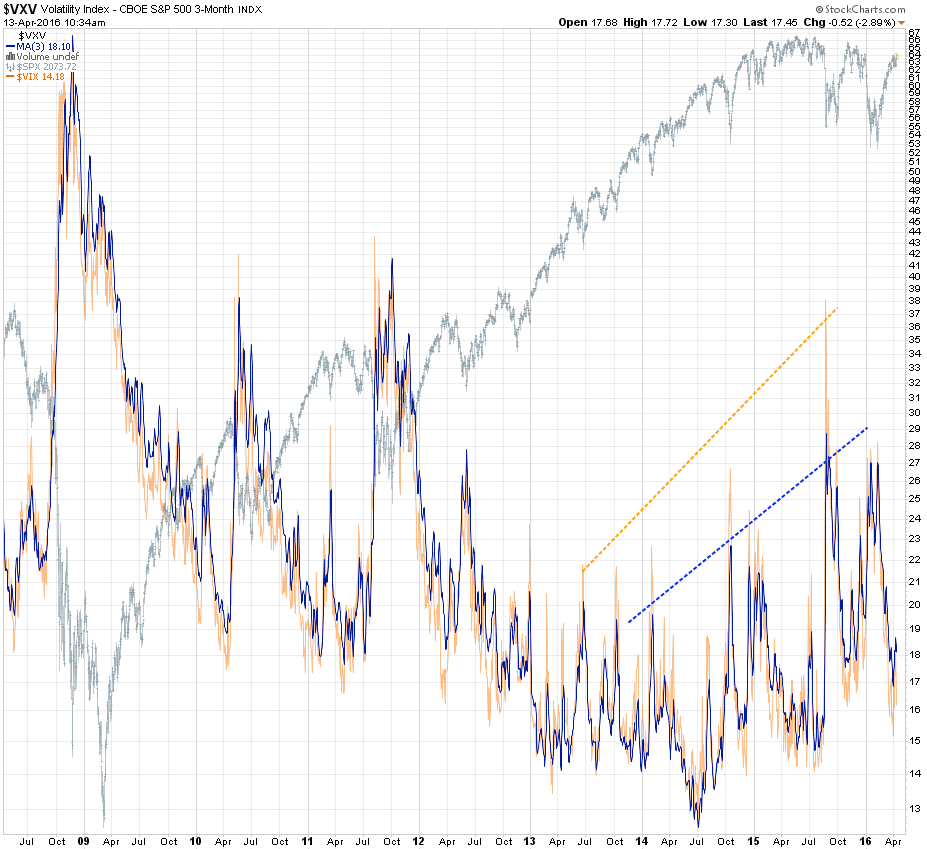
That’s easily figured out – placing them on top of each other shows us that the VIX rose quite a lot more than the VXV. One could argue that traders considered long term (quarterly) risk as more limited than short term (monthly) risk. Sure, that sounds plausible but why didn’t the same thinking apply back in 2010 through 2013? Most likely the 2008 crash was still fresher in people’s minds and apparently participants today are doubtful that we may see a repeat of that.
Alright, now that we are sufficiently warmed up, let’s dive into the good stuff:

It's not too late - learn how to consistently trade without worrying about the news, the clickbait, the daily drama and misinformation. If you are interested in becoming a subscriber then don't waste time and sign up here. The Zero indicator service also offers access to all Gold posts, so you actually get double the bang for your buck.
Please login or subscribe here to see the remainder of this post.


