


Mole ain’t gonna like this…
Mole ain’t gonna like this…
Howdy all, Berkster here. I know it is late, but I wanted to get these thoughts circulating before the weekend set in.
Mole has mentioned that ugly looking fractal that is showing up in the market now, aligned with the zero, and I have some more bad new for the bears. Not that I am throwing in the towel, I am just throwing a few more things out there that if confirmed, should have us looking to new highs. That said, I will lead off with my “preferred” road map. This is the bearish guide going forward, complete with levels that would quickly invalidate the entire count and have us looking for those ugly new highs.
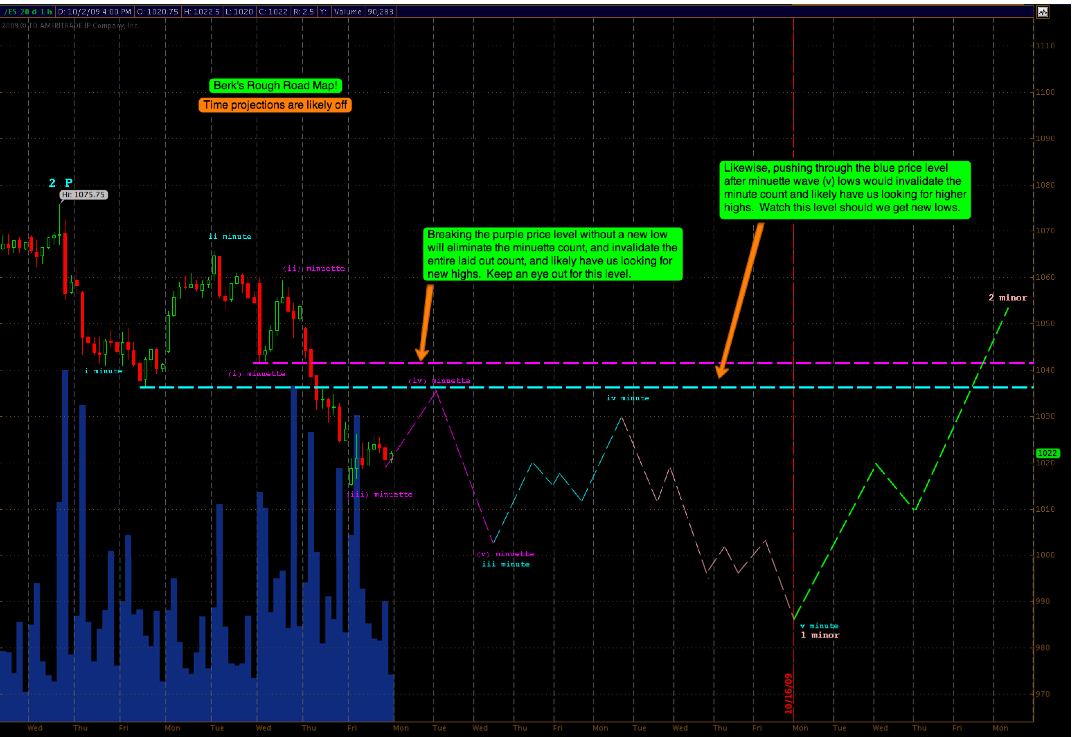
Bearish road map going forward
Alright… Please note that the waves, as labeled, are actually one degree too large. I.E. Minor wave are actually minute, etc. I didn’t have the time or patience to go back and change them… Please make do. This chart should be fairly simple to all of us. As it stands right now, I think we are in the middle of a 3rd wave down (sub-minuette degree). So long as we do not break the purple price level (Wednesday’s lows), we should still be safe to look lower. Once we put in a new low, we will be watching the blue price level (last Friday’s lows) to hold. Should either of those levels break, we would have overlap of 1 and 4 in my count, thereby eliminating it. There are other bearish counts on the table, but this one seems to be the most fitting. The bullish count is the one I have seen flying around here continuously (which leads me to believe it is not correct, but we will see) is that we have now put in a simple ABC correction in a 4th wave, looking for that long lost last push up to new highs. Again, that chart should be self-explanatory.
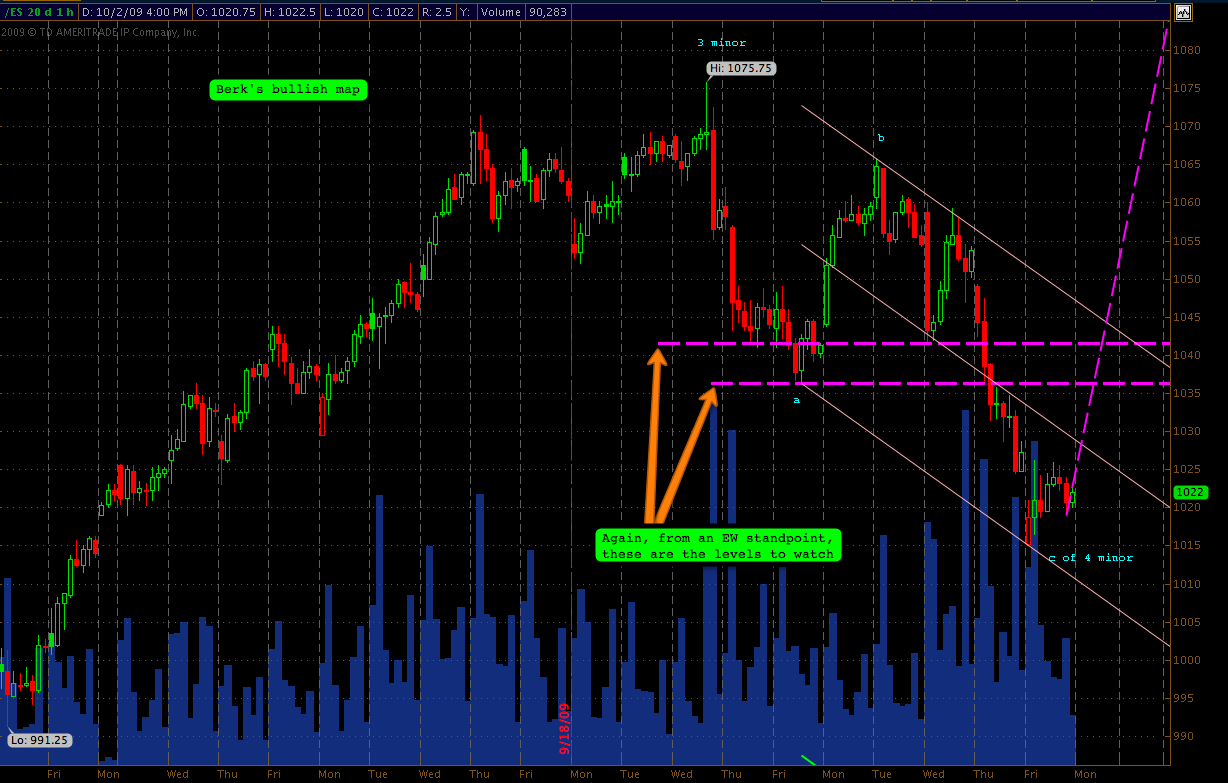
The bullish road map
Now for the meat of my post. I brought up my favorite of indicators today and did some hard looking. If you were here back when I was here before, then you know quite well how $VIX and I love to play. If not, hopefully you have been here when Mole has explained the $VIX buy and sell signals. Since these charts need a lot of words to describe them, I am going to assume you all know about the signals, or will ask the teachers if you don’t.
The first chart here is $VIX,$SPX comparison of waves (1) and (2) intermediate (of primary 1).
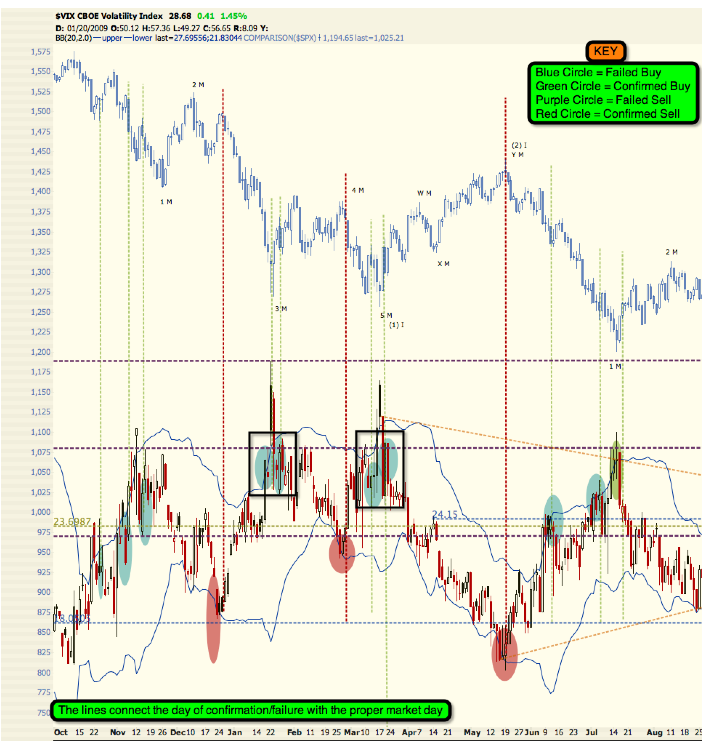
$VIX, $SPX thourgh intermediate wave 1-2
As you can clearly see, during the downtrend, the buy signals (confirmed or not) appear to be a toss up, with some being incredible short levels, and some actually leading to higher numbers. Sell signals in the downtrend are spot on as is plainly visible. I have noticed also, that if you manage to get two signals inside a week of each other, the likelihood of a rally is highly increased.
Chart number two is the same chart, just looking at intermediate wave 3, 4, and 5.
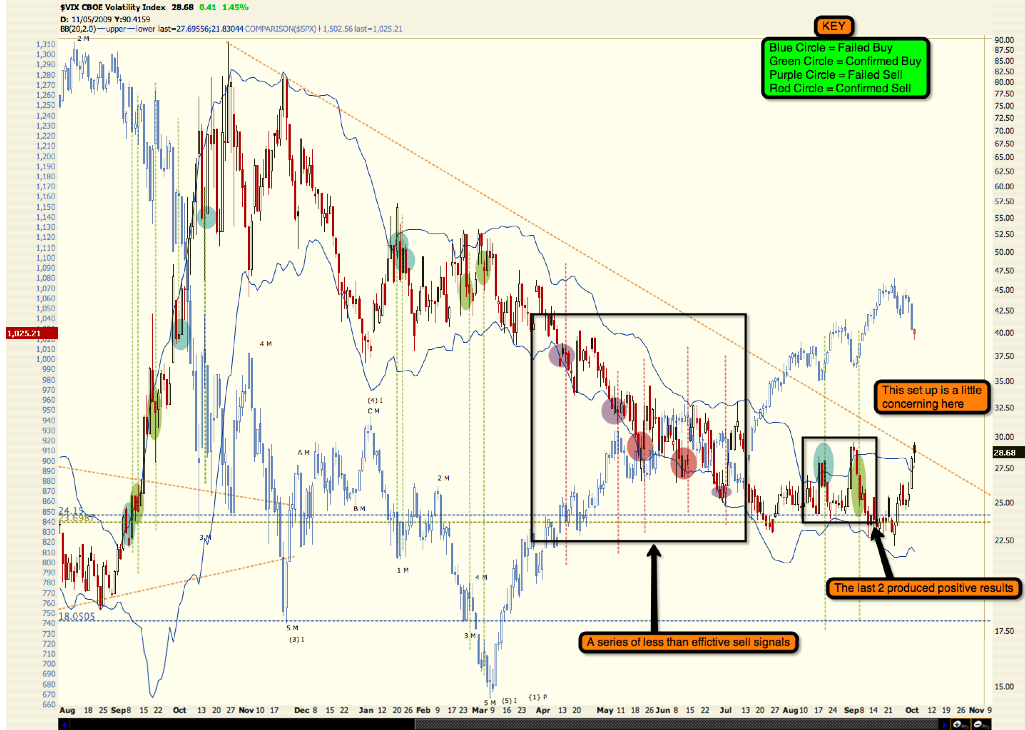
$VIX, $SPX in intermediate waves 3-5
As you can see, the buy signals while wave 3 was in force were completely worthless, whether confirmed or not. This is what we should be getting a lot of during primary wave 3 down. I am keeping a close eye on the $VIX here as we all know that it has hit the downward TL after rallying out of a strong base bear market supports.
The next chart is a close up of the series of sell signals in the box.
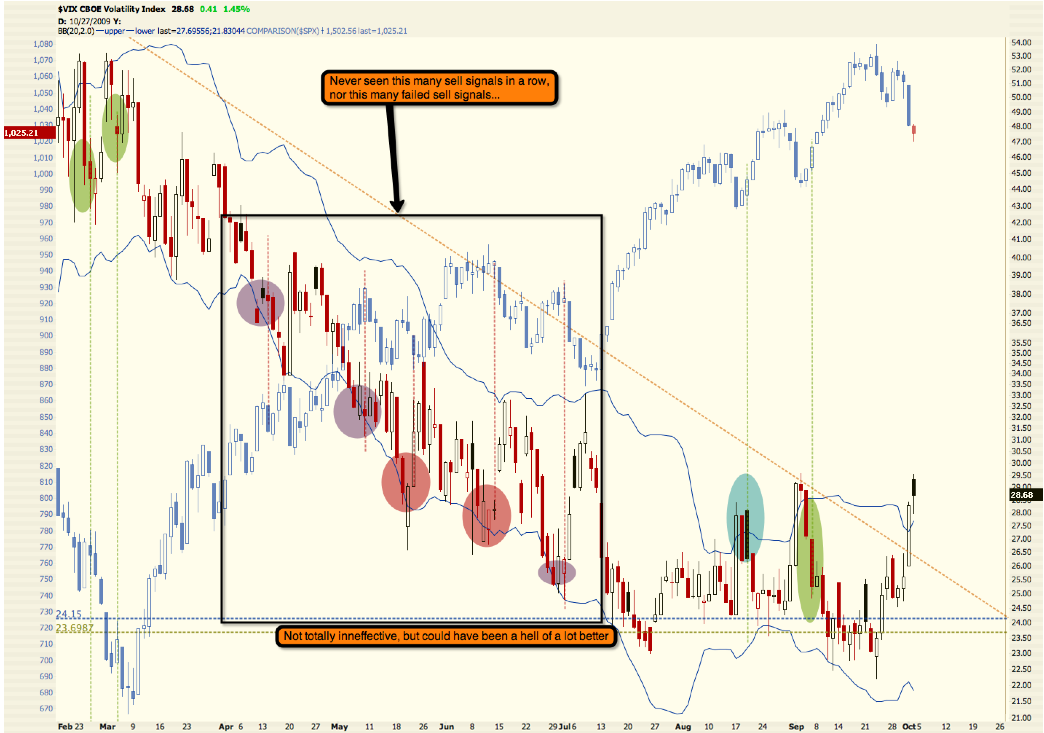
Close up of the sell signal series - PLEASE NOTE THIS BREAK-OUT DOES NOT EXIST. Prophet charts were being retarded.
As you can see, the sell signals during this massive uptrend were relatively ineffective. The last 2 worked out nicely, but hardly what one would have expected. Notice that there have not been that many sell signals (confirmed or otherwise) as far as I can track the $VIX back. What is more noticeable on this chart is 1) my TL from the peak has moved signaling a nice break-out (fucking charts: this break-out is not real, and is only seen here due to prophet charts retardedness) and 2) that we are set up for yet another buy signal from the exact same range from which the last two have been generated. As I said in the title, Mole ain’t gonna like that.
The last $VIX chart is showing the $VIX by itself, using the ranges that have been established from the beginning of this bear market (the range actually starts in the last 4th wave before the October ’07 peaks). The purple channel has been huge support. Had we broken it, we would strongly have to consider the market going drastically higher. I know, I know, thank god we bounced. What is bad though, is that the midpoint of the purple channel corresponds perfectly to the midpoint of the channel drawn (using weekly closes) of the bear market range from the 2000 peak. STRONG resistance, and not where I want to see a potential buy signal coming from.
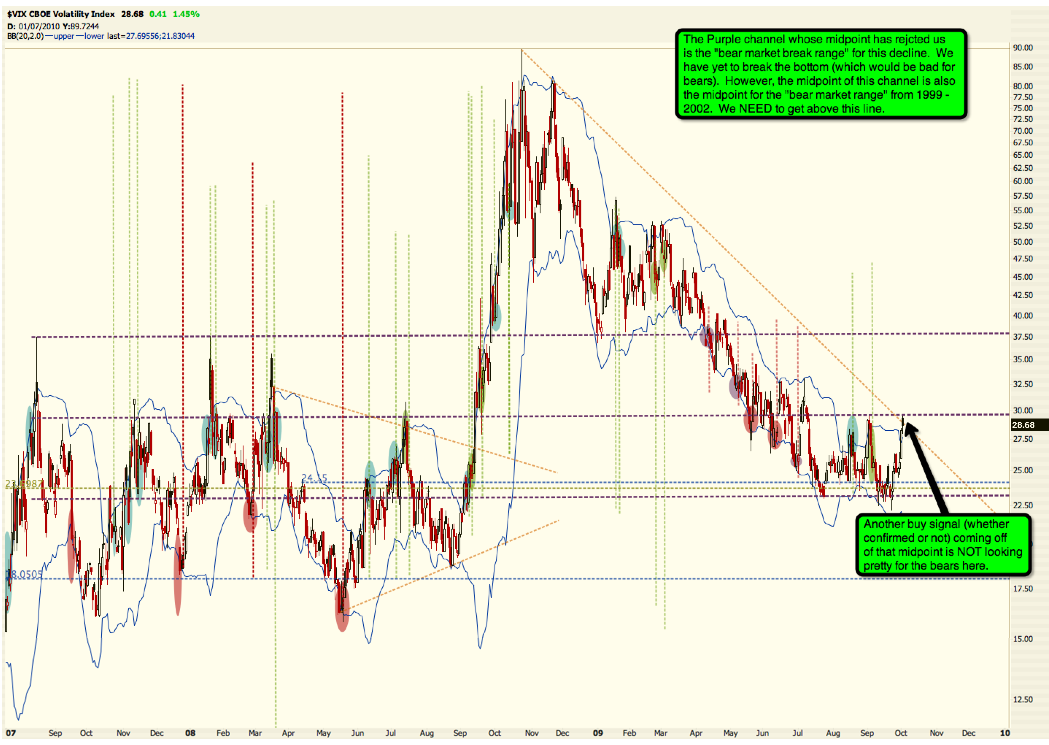
The $VIX respecting long term support and resistance
Once we can get beyond the purple channel’s midpoint, we should be fairly free and clear. Not holding my breath, but I am keeping my fingers crossed. Just given the combination of indicators, and lack of a fully cooperating market, this keeps us well within the inflection point. As with Mole, I maintain my bearish stance but am keeping a close eye on these things and my finger on the trigger.
I will have a few charts of individual stocks that I will post in the comments over the weekend. Plenty of stellar set-ups, ton that have already gone too far, and a few that remain coiled and ready for action. If we break the above sighted levels each (or any) index, I, personally, would be looking to go long some strong tech names, as the high-betas will damn sure lead that rally up. I few thoughts at the moment are BIDU (again), GOOG (both BIDU and GOOG could well rally into their respective earnings releases), AAPL (decent little flag there), would all be a good start. I’ll get to my list of shorts later in the weekend. Hope y’all enjoyed that, didn’t get the shit scared out of you, didn’t get confused, and had a great week.
Skål!
Sunday 9:00pm EDT: Mole here – this was an excellent post which basically reflected most of my concerns regarding the continuation of the current down wave. There really wasn’t much to add, so I decided to leave it up as our weekend post. The one chart I however would like to throw into the mix is the daily Zero:

I think the fractal nature of these two down waves is quite obvious – and in light of a possible repeat of the VIX sell signal (which did coincide with the September pattern) the evil lair bull trap alert system officially switched to orange. Tomorrow’s tape will be key – if we get a down day and the VIX closes outside the 2.0 BB we might get a continuation of this drop. But if we have another sideways or slight up day I might just scale out of my puts and reload either once we have a downward confirmation or make new highs. If you’re nervous keep in mind those trigger levels Berk offered on his first chart – they coincide with my own count and are spot on.
See you on the other side.
Cheers,
Mole


