


Pre-Market Warm Up – by gmak
Pre-Market Warm Up – by gmak
Mole’s post was pretty good in terms of setting up where we are and scenarios going forward. I’m not really a scenario person since there are so many factors. My philosophy is that the Market drives the TA, not the other way around. My trading style is continously changing (hopefully improving) and I find myself pulled more and more towards trends and contra-trends.
On a longer term basis, no one can deny that SPX is in an up trend. It is easier to swim with the current than against. A basic trading strategy would be to only take high reward /low risk situations on the long side, within that broader upward trend. Trend lines, FIBs, Pivots all provide areas for determining the validity of a trade. TSI, MACD, TD Pressure and so forth can provide an indication of when a trend is changing. Between the two, one can practice proper risk management.
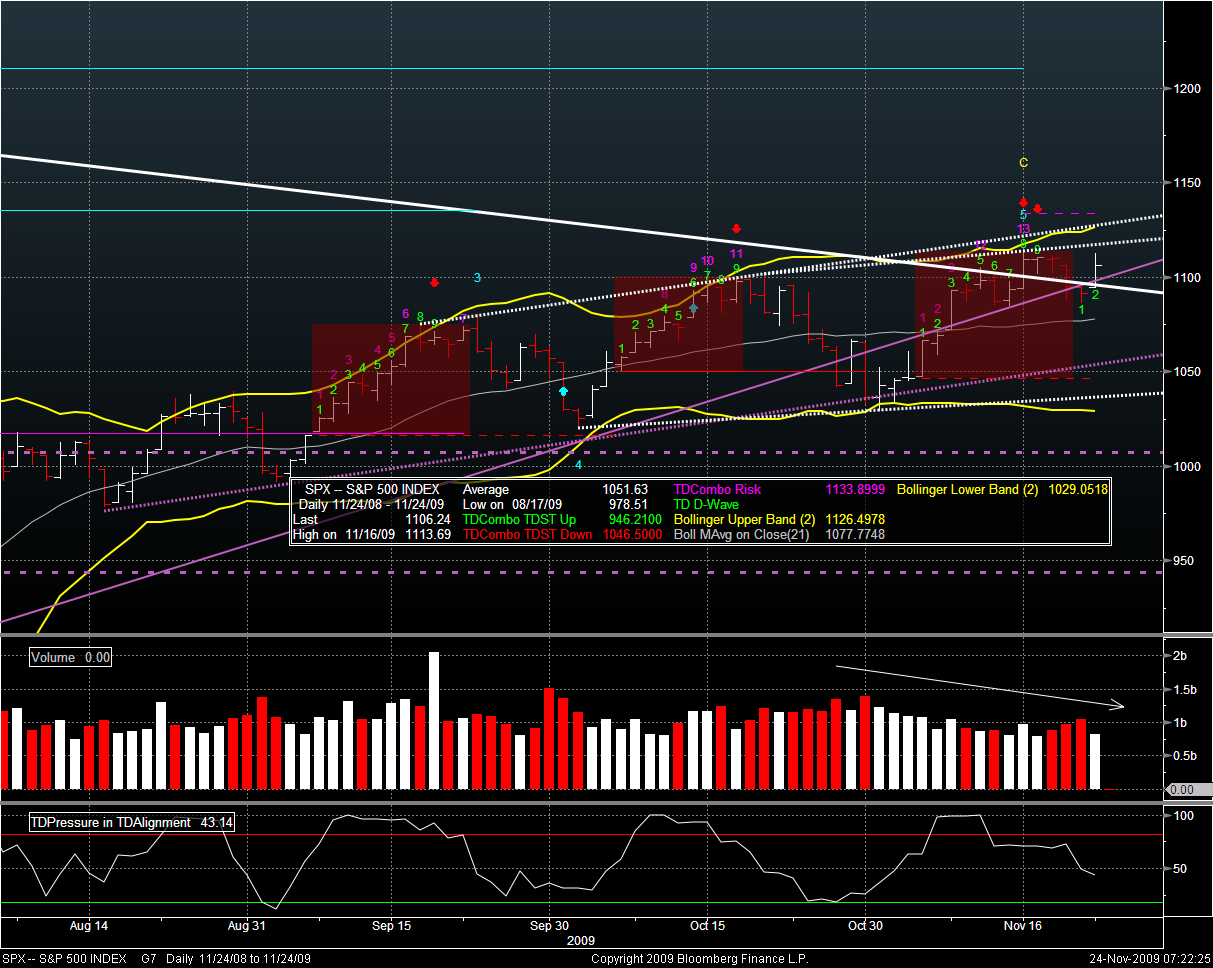
The chart above is a little busy – but will help me to explain. Say that near the close yesterday I flipped a coin and it said “go long”. To me the chart looks like bad news waiting to happen no matter what trade I put on (risk /reward doesn’t look good). Stops, depending on one’s individual risk tolerance, could be put at the following locations:
- Below Yesterday’s low (1094.88) – A cost of 12 points if the trade is wrong. This also assumes that today would be another up day without any retrace intra-day
- Below the low of the prior day (bar number ‘1’ = 1086.81). This would cost 20 points – but would be of the philosophy that SPX will continue up. Only setting a new local low would negate that view.
- At the mid bollinger (1077.77) – well, you get the picture. Being wrong would cost about 30 points here.
What could I hope to make with this trade?
- The first dotted trend line would permit a higher high in the daily SPX – but it is at 1117ish; SPX is looking tired and this is the dominant trend line in the short term. Profit = 11 points. Risking 12 points to make 11 points. I would have to be quite confident about the direction to do this.
- What does the TA say? Same as yesterday. TD Pressure still points down. TD setup is in a BUY count – which means price is likely to go down. Support areas are wide and “far away”, but so are resistance levels. SPX is in the middle.
To me, SPX is floating in the middle of a series of support and resistance levels with the bias down. Volumes are low on up days and high on down days. This sure looks like DISTRIBUTION (thanks, Mole for clearly demonstrating that in your post). The bias is down (short term) IMHO, but the cost of being wrong is too high, if one were to use resistance levels provided by trends and TA.
I wouldn’t take a position here, although there may be some room for intra-day swing trades (see the ES chart below).
Equity
Asia was red by over 1%. China fell 3.5%. Europe is mixed but flat, with the DAX having just turned up postive.
It opened well in the red, but something after 5 AM EST really lit a fire under it. MoM industrial new orders were up 1.5% vs expectations of 0.7% and prior of 0.6%. As well, German business confidence was up yet again. But notice how DAX has run into selling at the 5805 – 5910 level and is retesting.
Unlike yesterday, the DAX is mixed – as one would expect if it were more or less flat.
Given the stats, one should not be surprised to see rotation back into Basic materials and industrials, and away from services financials and utilties.
The ES seems to be putting in the cup and handle pattern – but like the DAX, is putting in a double top at the present time. Notice how it ran up at the same time as the DAX – 5AM EST. If you want to trade overnight, watch the european news. You can find it here in FX-related items.
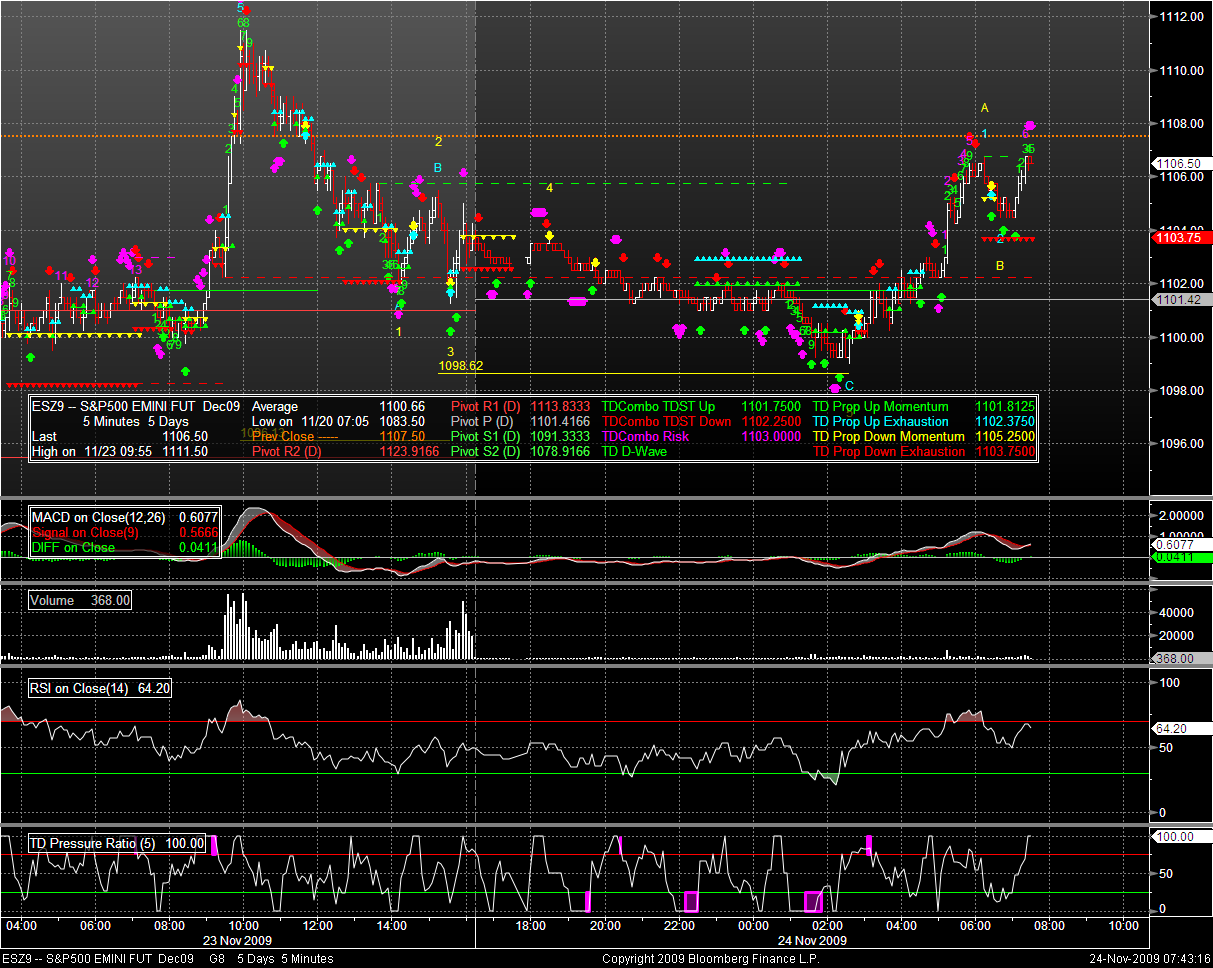
ES pivots:
- R2: 1124 = a new high and blow out for SPX if it were to happen
- R1: 1114 = Also a new high
- Neutral: 1101.50 = acted as support overnight. Got broken but then the European and German news but a bid under the ES and pushed it up to today’s HOD (so far).
- S1: 1091.50 = This has been a support level for a good number of hours in the AH, over several days. NO reason to think that this would not continue.
- S2: 1079 = Yeah, right.
FX
USD has turned weaker as I type. CAD, GBP are weaker. JPY and EUR are stronger. Risk aversion but attractive economic growth in Europe are probably the underlying reason. DXY began falling at 2:30 AM EST and only has one green 30 min candle since then. 74.95 is the level to watch in the short term, as going below this would put in a lower low. TD Pressure says we’re due for a bit of a retrace up – but MACD says DXY is still seeing downward pressure.
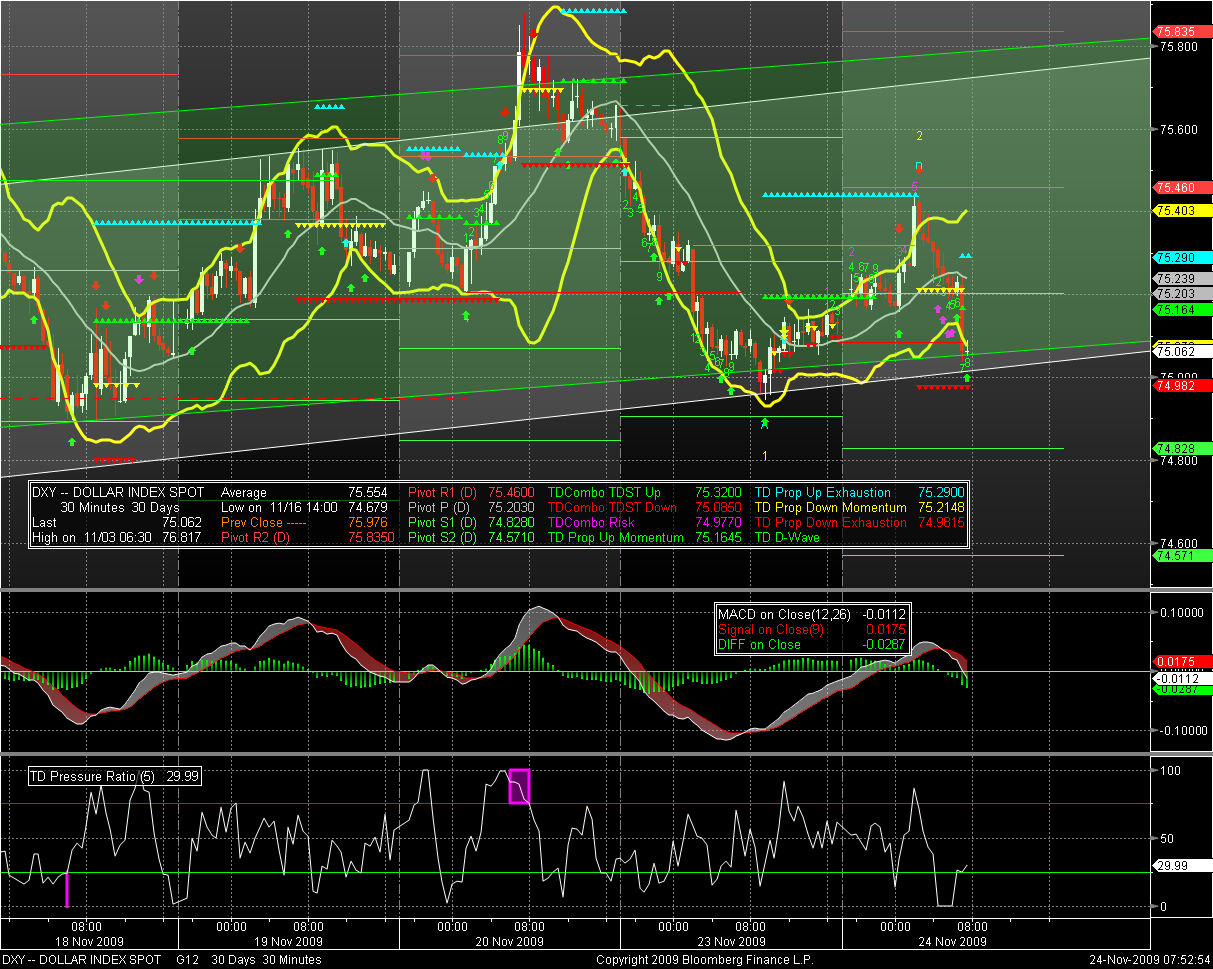
Pivots orf note:
- R2: 75.835 = a route for SPX
- R1: 75.46 = Turned back the rising tide this morning.
- Neutral: 75.209 = was support (about 1.5 – 2 hours) on the way down
- S1: 74.828 = Bad juju if we get here. There is a qualified TD support level at 75.085 that is working some magic – but the yellow and red picket fences are both double density and say that 74.982 is a plausible target before price exhaustion and buying comes in.
- S2: 74.571 = Have yourself a sad, sad Xmas.
The EUR has been range bound (like the DXY), but in a very wide range between 1.4828 and 1.50 since Nov 12. It looks like the news this AM put the bid under it and stopped the downward cycle. 1.50 is the key level to put in a recent new high. 1.4828 is quite a solid floor at the present time.
NEWS
- The good European news already mentioned.
- Some 2nd derivative green shoots related to housing
- See here:
DATA
8:30 EST
- GDP; Personal consumption
9:00 EST
- CaseSHiller home data
10:00 EST
- Consumer confidence
- Richmond Fed mfg index
14:00 EST
- FOMC minutes – be careful around this time. This is an excuse for stop running in BOTH directions
Here you go:
The bottom line is that it is easy to make a case for long or short – but the levels where you could tell if you were wrong or not are relatively far away and about equal to the reward. Today feels like a scalping day. Play the intra-day trend using pivots and FIB lines.
Cheers.


