


Realized Volatility Profiles: Futures
Realized Volatility Profiles: Futures
Today I will introduce an aspect of volatility that you most likely have not seen being addressed anywhere else: realized volatility profiles. First up let’s make sure you all understand what realized volatility (RV) is and how it compares to implied volatility (IV). Simply RV measures the amount and amplitude of price change observed in a financial instrument over time. Big moves to the up side and down side will both produce spikes in RV. As such the volatility we measure or predict always produces an unsigned return – it does not care whether the market goes up or down.
Implied volatility also produces an unsigned return but it works a little differently. A widely observed measure of IV in equities is the VIX, which rises when prices fall and falls when prices are on the rise. However it never even gets close to the zero mark and there are no negative readings. The reason for that are pretty simple – IV’s goal is to measure the expectation of volatility and as such rising prices are considered positive and thus less ‘volatile’ as falling prices. One could say that IV measures how investors/traders ‘feel’ about the market and what they expect will happen in the future. This also explains why you will often see the VIX fall a little after a big IV spike to the upside. Although fear most likely prevails the expectation is that the probability of more downside (in the underlying) is now more limited. As such IV is a bit of a strange beast and many traders use it on a daily basis without fully appreciating what it really represents.
As a side note: Ernie Chan recently wrote a very interesting post on his Quantitive Trading blog that suggests that on average, an increase in realized volatility due to negative returns is … accompanied by a decrease in implied volatility. I had to read this one several times to make sure I didn’t get it wrong. He does concede that a very negative return in SPY is indeed usually accompanied by an increase in implied volatility or VXX (a Barclay ETN based on the VIX). Isn’t that fascinating? On a day to day basis, outside the big moves, negative moves inside the standard deviation apparently still produce a decrease in IV 57% of the time.
I mentioned this because I want you to understand that realized RV differs from IV, and not only is it much easier to understand but is also much more predictable. Which in fact is the main theme of this and future posts on the topic. Today’s installment aims at establish a basic understanding of how I measure RV and how I use it to anticipate various RV cycles:
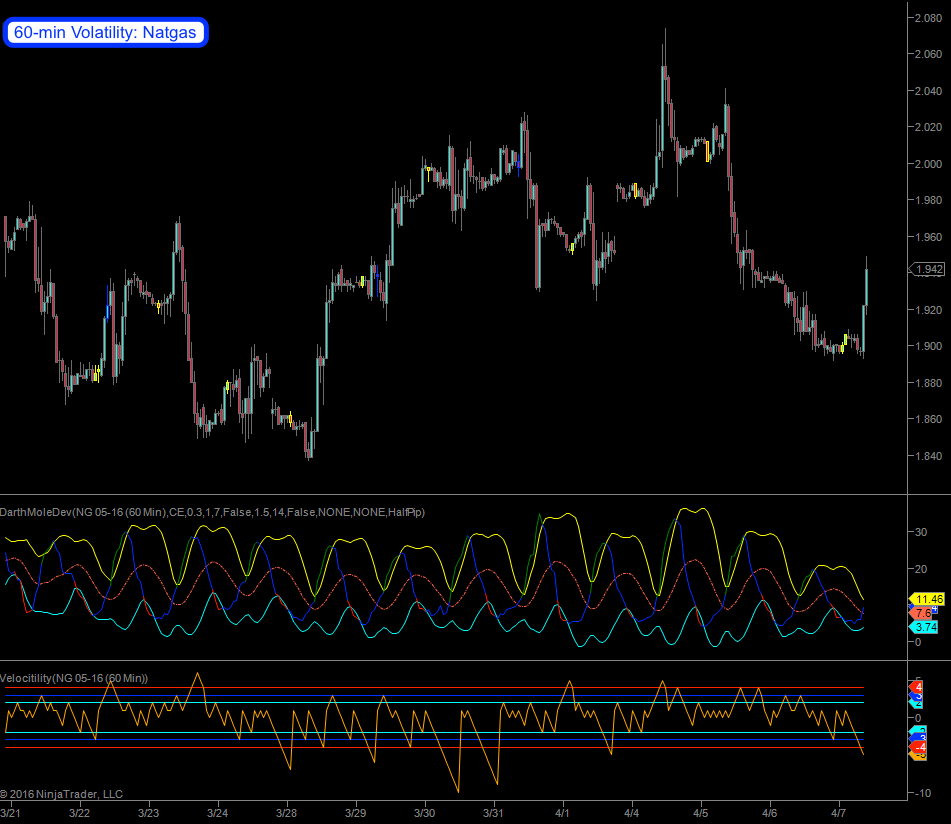
And what better way to do that than to actually show you an example. What you are looking at above is a 60-minute chart of natgas. The reason why I use 60-min charts is because they best reflect my trading window (hours to days) and as it turns out volatility flows in relatively predictable cycles within that timeframe. The indicator in the middle is called the Mole which I rolled myself – it’s a hacked version of ATR and I simply slapped a Bollinger around it. The rest is a bit of white man magic which means fiddling with the settings to produce something meaningful.
Natgas doesn’t have the best reputation among traders, as a matter of fact we often call it the ‘widow maker’, but it does feature a very clean (realized) volatility cycle. As you can see prices flow from slow periods into fast periods. The cycles are similar in amplitude and frequency – if you would record a few months of this and hook the signal up to an oscilloscope then you would hear a relatively even and audible sound. So let’s try to produce a volatility profile for Natgas:
Natgas Realized Volatility Profile
Frequency: Regular
Amplitude: Regular
Standard Deviation: Low to Medium
Overall Noise: Low
Transition Noise: Low
Resolution Noise: Low
Velocity: Fast
When I refer to standard deviation then I talk about the delta between the slow periods and the more volatile periods. If you look at the yellow candles, which mark the point at which we expect volatility to expand, then it’s clear that most of them are pretty tiny in comparison to the big moves that follow.
Overall noise means that we’re not observing a lot of sideways whipsaw across all the entire volatility sine wave. There are occasional traps but in comparison with other futures symbols natural gas seems to be a veritable fun house for swing traders. Short term volatility swings seem to be very predictable and if you manage to get a seat on the bus you’re in for a good ride.
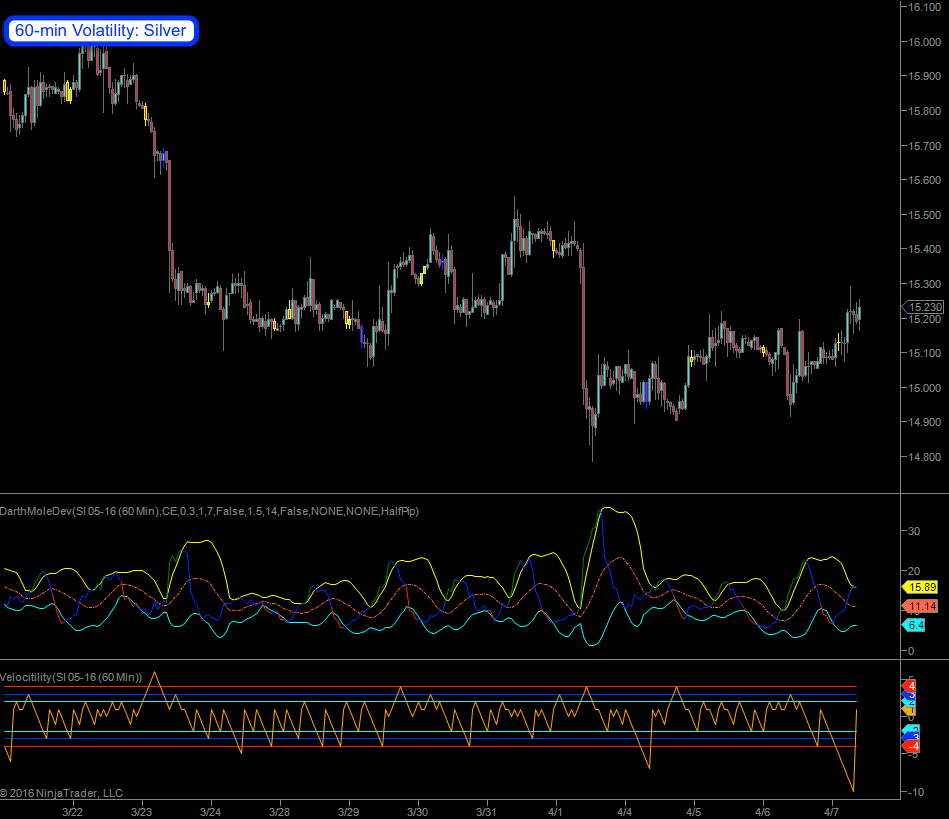
Now let me show you a contract that is difficult to trade on a short term basis as volatility swings are more random and trend phases often do not manage to get out of the gate: silver.
Silver Realized Volatility Profile
Frequency: Irregular
Amplitude: Irregular
Standard Deviation: Large
Overall Noise: High
Transition Noise: Medium
Resolution Noise: Low
Velocity: Medium
Just looking at that volatility signal gives me shivers. Although the Mole indicator does a pretty good job at predicting volatility trying to trade it in gold would most likely result in a good number of consecutive losers. The transition noise between low and high volatility is medium (I have actually seen worse). It’s not impossible but you probably still need to employ other measures and pick your entries wisely.
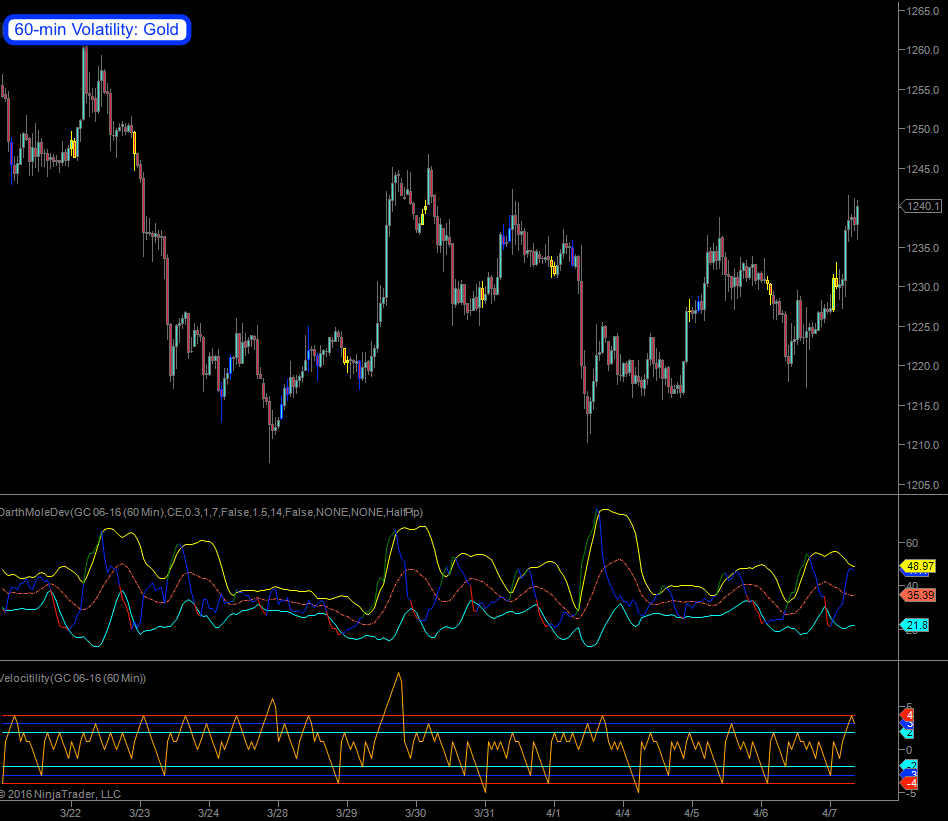
Not surprisingly gold isn’t much better:
Gold Realized Volatility Profile
Frequency: Irregular
Amplitude: Irregular
Standard Deviation: Large
Overall Noise: High
Transition Noise: High
Resolution Noise: Low
Velocity: High
Although gold has high velocity and low resolution noise (when it moves it moves and doesn’t look back) it has one big draw back: Transition noise appears to be high. Look at the blue candles – those mark periods when volatility is on the rise but isn’t pushing above the upper standard deviation bubble yet. It regularly produces consecutive candles with large wicks within a range which is fancy speak for saying that it’s trying to kick you out of your campaign before taking off. Silver does it as well but I think gold really has it down to a science.
More profiles below for subscribers, we’ll cover wheat, crude, copper, the bonds, and of course the spoos. Please join me in the lair:

It's not too late - learn how to consistently trade without worrying about the news, the clickbait, the daily drama and misinformation. If you are interested in becoming a subscriber then don't waste time and sign up here. The Zero indicator service also offers access to all Gold posts, so you actually get double the bang for your buck.
Please login or subscribe here to see the remainder of this post.
I hope this post opened a perspective on the market that you didn’t even know existed. You can probably experiment around by yourself via the ATR indicator and get a good feel for how each contract flows. Next week I will follow up with short term charts on the Forex side and then we’ll be looking at the daily panels. So plenty of material to work through and I expect it will significantly aid you in anticipating volatility swings and thus in picking your entries moving forward.
Free Sub Available
By the way if you are interested in the Mole indicator: Subscribers are actually able to sign up for volatility alerts which are triggered near the end of the low cycle (i.e. yellow candles). It’s a free sub available on the signup page – but you need to be an existing subscriber of either Gold, the Zero, or any of the systems offered.


