


Stop Focusing On Price
Stop Focusing On Price
I sense that some of you are struggling with the fact that the tape is pushing everyone’s buttons right now. But quite frankly things couldn’t be any more clearer at the moment, assuming you know how to understand the market’s language. In order to do that you must detach yourself from focusing on variations in price and instead focus on volatility. If your time traveling pal from the future is kind enough to send you the closing price of next week you may still find yourself losing (i.e. being stopped out in the interim). Because how we get from a to z makes all the difference – in life as well as in trading the market.
In physics we differentiate between speed and velocity. In case you snoozed through that particular lesson allow me a quick refresher. Speed only measures how fast you move whilst velocity has a directional component. An airplane moving toward West at 300mph on average has a velocity of 300mph – it also has a speed of 300mph. An airplane circling an airfield at 300mph has an effective average velocity of zero but it still moves at a speed of 300mph. A very simplified formula for measuring those two variables are:
Average Speed = Distance Traveled / Time Of Travel
Average Velocity = Displacement / Time

With the exception of certain option strategies (e.g. condors, straddles, strangles) monetary reward in trading usually relies on price displacement. So it is natural that everyone always focuses on price changes – in other words we become obsessed with velocity . However by doing so you are not seeing the forest for all the trees. The key to understanding market behavior and thus assessing probability of outcome as well as risk lies in assessing and adjusting to volatility cycles, which relate to speed. Both speed and velocity describe market cycles. The higher the ratio between velocity and speed the more trending is the current market phase. The lower the ratio (with speed outweighing velocity) the more sideways the market. Speed can be predicted to a certain extend – but the ratio between those two cannot.
Like an automobile on a road trip the market shifts between low speed and high speed periods. What complicates matters is that speed does not necessitate a strong directional component. In other words – we may be moving at high speed but our relative velocity may be slow. Had I told you on 8/20 that the spoos would be trading at 2006 today then that information would have been relatively useless. Yes, you could have bought some futures and held them all through today but it’s possible that margin would have bit you in the butt somewhere on the way down.
If you look at the orange box, there are things I would like you to focus on. The first one is price of course – very directional and fast. The second is the volatility signal on the daily DarthMole which shows a veritable explosion after a long period of sideways churn. After that look at the blue box – price is still moving fast but things are slowing down now. So what market cycle are we in? Clearly compared with the prior weeks volatility is very high but *relative to the current market phase volatility is depleting*. This is an important realization, wouldn’t you say? When folks refer to high or low price volatility then you should ask ‘compared to what?’
The red box shows us a nice trending move to the upside but on the volatility end we are pretty much where we were in the previous box. And relative to what the market did a few weeks ago volatility is still sky high. What we learn from this is the following:
- Volatility is always relative.
- Market cycles happen in all volatility stages (i.e. trending, sideways, corrective, etc.).
- Future volatility is only predictable near its extremes.
The current tape is a great example. The standard deviation bubble shows us that we are near the lower range right now which means that we may see acceleration here soon. Of course making things a bit trickier is that we are already in a high volatility range so there is plenty of room toward the bottom. Meaning we could just plot sideways here for a few weeks or we could slowly climb higher here whilst volatility is slowly depleting. I know that is a bit of a mind bender in the beginning but realize that an orderly advance is usually accompanied by depleting or sideways volatility. Only sudden fast moves extend volatility readings – i.e. long candles.
The volatility cycle was quite a bit easier to predict when things were gyrating sideways during the summer season. Every time volatility was dipping toward its lows odds suggested an acceleration was on the books for the near future. As of right now what we do know is that volatility is high and most likely won’t return to summer readings in the near future. Therefore we should always expect fast moves in either direction. And that means we keep our stops loose and take little risks. Most people do the opposite – they play small or stay out during little moves (i.e. the summer months) whilst making big bets during high volatility periods. Which of course results in major losses over the long term.
So I ask you – what really is the difference between participating in range bound markets and trending markets? I’m glad you asked!
- Low volatility range bound markets are actually most predictable. This permits you to play larger position sizes and keep tighter stops.
- High volatility range bounds markets should be hould be traded via small position sizes and wide stops. Otherwise you will most likely just wind up being thrown off the horse.
- Trending low volatility markets on the other hand are a trend trader’s manna from heaven. You pick your spot and are able to choose a stop a reasonable distance away (e.g. 1 stdev or the recent spike low/high).
- Trending high volatility markets – well, anything can happen but if you manage to get a seat on the bus even a small position size can bank you some handsome coin. Therefore you trade them like high volatility range bounds markets.
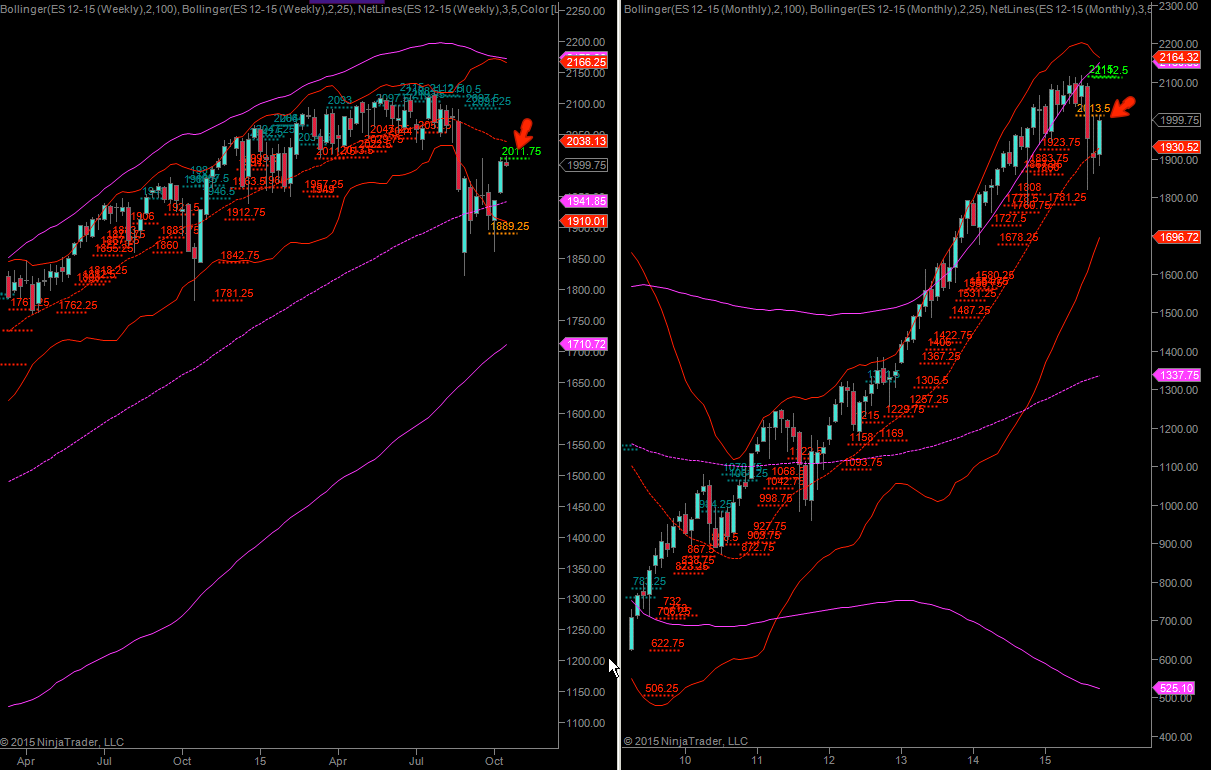
Let’s just consider how the current move fits into the general market cycle which is observable (to some extent) on any chart you have ever looked at. We are slowing down a bit right now as we are touching important weekly/monthly inflection points. We do know that volatility is still high and it has not dropped low enough to assume that it can’t drop any lower. But let’s not forget – volatility does not have a directional component, it only shows us the speed at which we’re moving.
We are at an inflection point and in terms of speed we need to allow for another fast move for the foreseeable future. At the same time we are currently either at the tail end of a directional period or are about to enter its final blow off phase. So the odds of a higher volatility sideways or trending period are high. I said higher – and not high for a reason however. Remember, it’s all relative and volatility cycles should always be considered in context.

And all that is good information. The fact that volatility may expand again works for us if we get a fast move and we grabbed a seat on the bus. As we are near an inflection point depleting volatility will also help us IF we start trending (down or up). The only situation that won’t work well for us near LT inflection points is a sideways low volatility trading range. It’s always a possibility of course and there is no predicting this.
Given all this I am currently long with a stop fairly close by below that 100-hour SMA where I think the rubber meets the road. If proven right I will leave my stop there for a while as I want it to be loose to sustain stop runs. I am going to watch the Zero like a hawk to make sure that momentum/participation supports price in either direction. My concern right now is to play a possible outlier move which means I keep my position sizing small. At least for now – things may look different in a few days if we haven’t progressed in either direction.

It’s not too late – learn how to consistently bank coin without news, drama, and all the misinformation. If you are interested in becoming a subscriber then don’t waste time and sign up here. The Zero indicator service also offers access to all Gold posts, so you actually get double the bang for your buck.
Cheers,


