


The Sweet Spot
The Sweet Spot
In the past weeks I have been seeing an increasing amount of charts by analysts predicting an impending large scale correction. There is much talk about turn dates, ominous death crosses, and what have you. I for one have played my part as my long term analysis suggests the possibility of a wipeout, but to my credit I have thus far managed to keep you guys ahead of the tape at several inflection points [1][2][3]. I’m trying to keep it this way but in order to survive in this market you better be prepared to run with the best.
The goal of this post is evaluate the possibility of a large scale correction in the near term future. That means today, tomorrow until about early next week. Let me precede the following with a few caveats:
- I don’t have a crystal ball and I could be wrong. This game has always been and will always be one of playing the probabilities, however surprise moves do happen. Read ‘The Black Swan’ by Nicholas Taleb.
- In general top/bottom hunting results in losses and bruised egos.
- The tape becomes less readable as volatility increases. FWIW it also becomes less readable during low volatility periods. It’s regular volatility we enjoy the most 😉
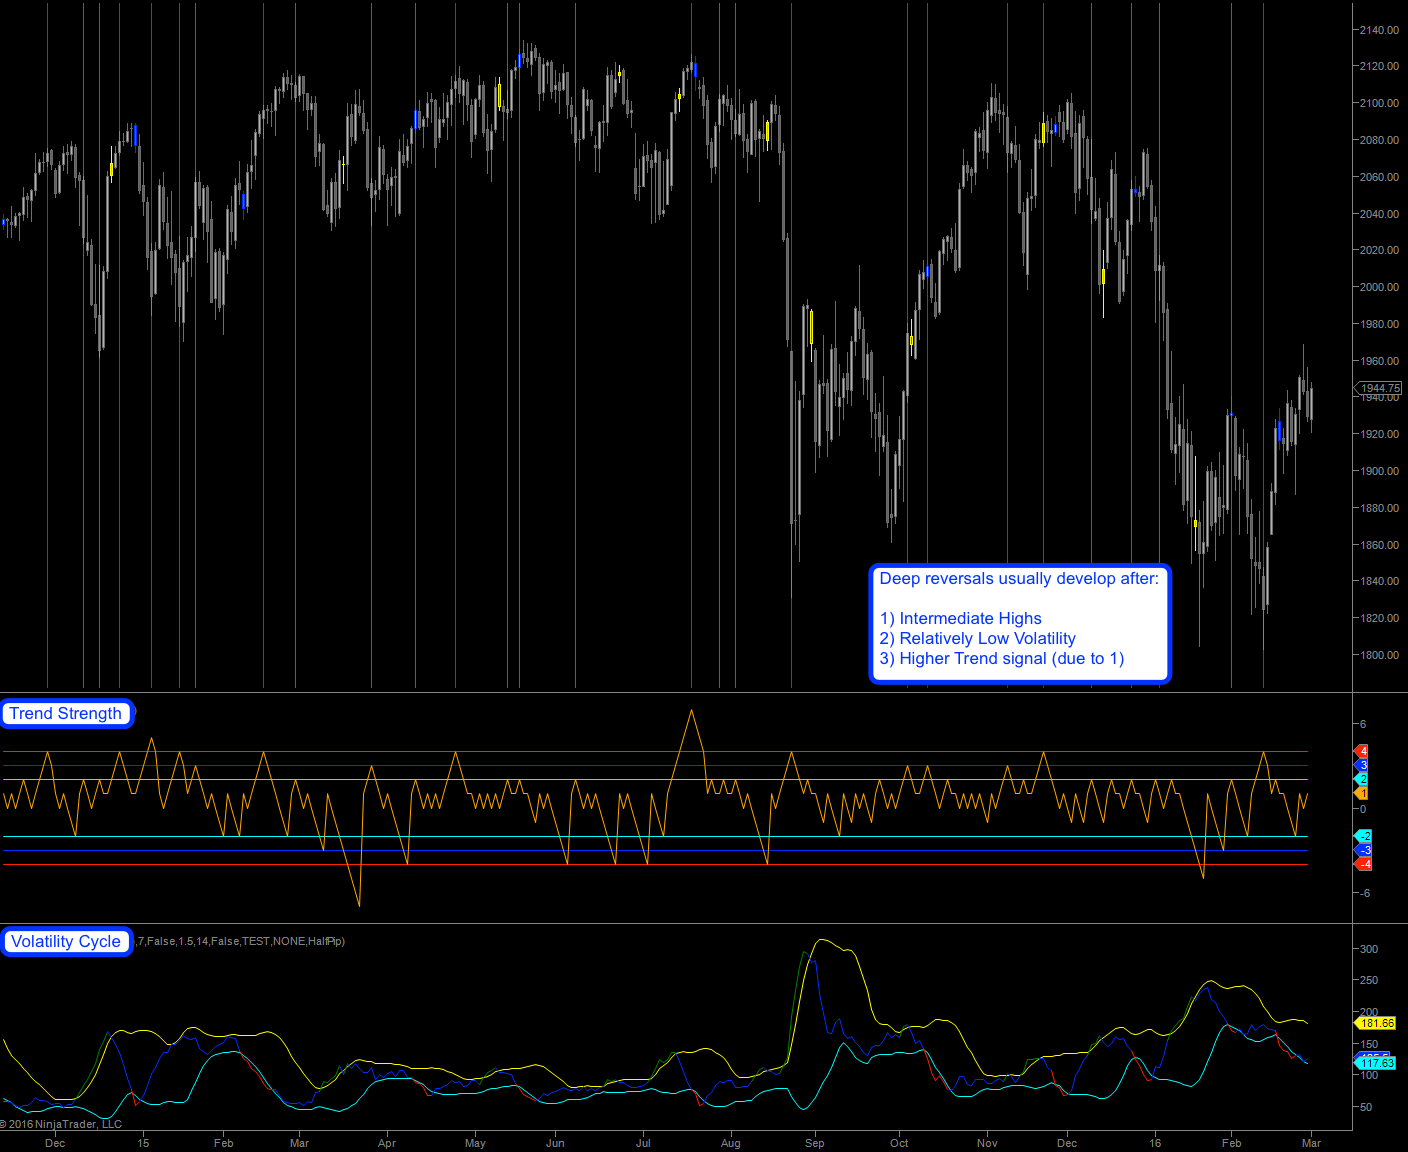
With that out of the way let me introduce you to a chart I use in the context of my long term perspective. There are two indicators here and most likely you are unfamiliar with both of them as they are ‘homebrewed’ so to say. The one on top depicts trend strength and the one on the bottom volatility cycles. I should point out that the latter doesn’t work very well in equities as quantitative easing has effectively shot ‘natural’ volatility cycles to hell. However we still recognize volatility extremes and how trending moves usually develop from a [relative] low base.
Back to the trend strength as it requires a bit of explaining. First of all a high signal here indicates a strong trending move, which in itself of course increases the odds of a reversal. In range bound tape you will see that signal bump against the 1 or 2 mark and then usually produce a contrarian candle. In strongly trending tape (up or down – the indicator is not biased in one direction) you may see this signal reach extremes far outside the previous range, e.g. note how we got a push all the way to 6 before the big sell off last August. In case you’re wondering – preceding trend jumps apparently have little influence on subsequent sell offs.
On the downside we are talking ‘lack of strength’ – for instance an extended period of whipsaw can push this signal all the way to -4 or lower. The zero mark of course represents equilibrium from where pretty much anything can happen. Which is where we we finished on the 26th and yesterday we pushed to the 1 mark as we produced a second down candle. Clear so far?
Now what we set off to learn are the types of conditions that precede large scale sell offs. From what I could gather the following conditions seem favorable:
- An intermediate high of some sort. Although we fell off the plate without directly preceding it we did paint one which subsequently was followed by a sideways range.
- Relatively low volatility. Again I should point out that weeks may pass until the final move to the downside. However prices usually seem to remain inside a range, thus the observation is valid.
- A higher trend signal, and by that I mean anything touching 2 or higher.
The yellow lines above show us the more extreme signals and the pale blue ones the smaller ones. Usually the tape gives you a day or two to get positioned, thus it doesn’t really matter how high it really pushed. What does matter is that we got a reversal and the signal drops. Once again – these signals apply to both bullish and bearish moves.
As the signal is currently on the rise I would expect more trending tape here. Well, in theory anything can happen here but volatility is dropping and we are still inside a short term advance (in the context of the big picture the daily chart is short term). Thus the current conditions suggest to me that a push higher would represent the most favorable conditions for short sellers.

Here’s a few more years of that chart for your records. As you can see we sometimes get a strong signal without a reversal, especially in very strong advances. But if you think about it – that’s important evidence for trend traders. If you get a strong signal like that and the tape merely puts in a small zig-zag after which previous highs/lows are being breached then resuming your original campaign has good odds.
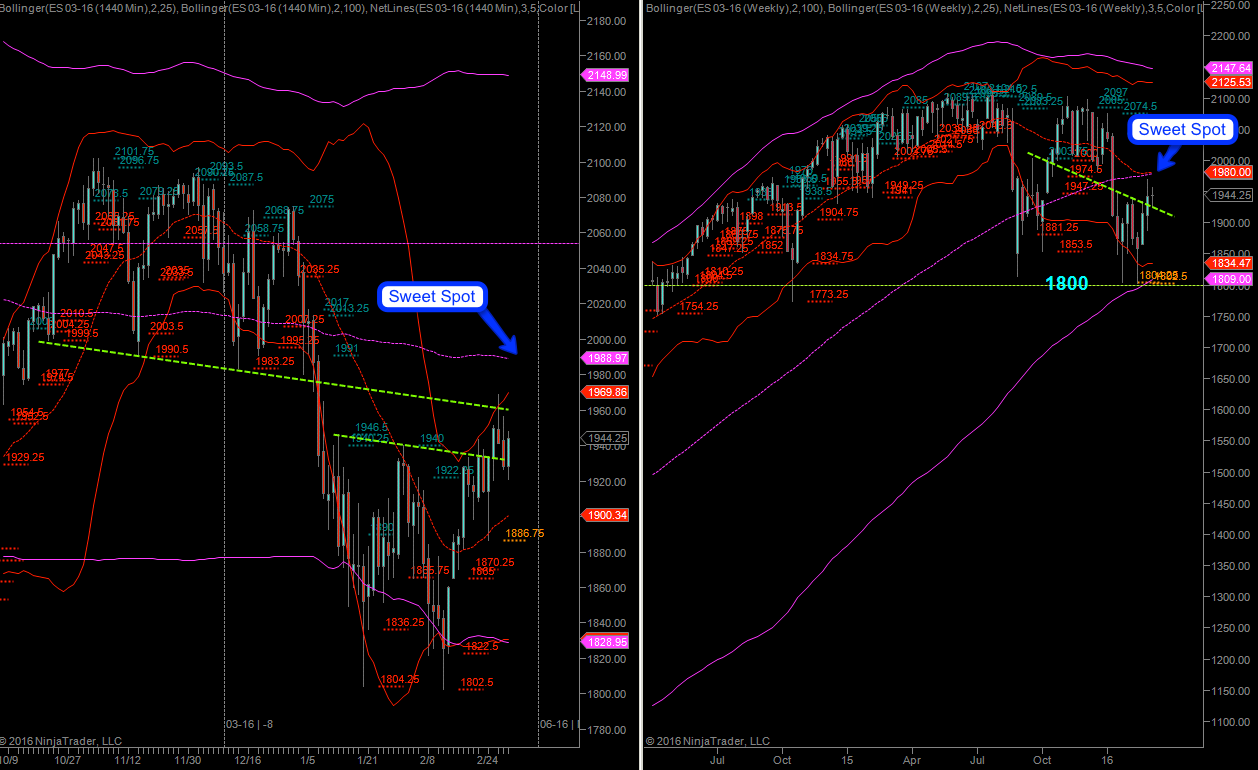
Now currently the bulls are still attempting to cross the Rubicon and what I would like to see (and of course may not get) is a push toward the ES 1990 mark. In combination with a strength signal on the trend indicator above would in my mind represent the ‘sweet spot’ some of us have been waiting for. A short campaign there may still fail of course – nothing in this racket is ever a sure bet – but at least we would have the odds in our favor and that certainly helps.
A few more charts below the fold for my intrepid subs:

It's not too late - learn how to consistently trade without worrying about the news, the clickbait, the daily drama and misinformation. If you are interested in becoming a subscriber then don't waste time and sign up here. The Zero indicator service also offers access to all Gold posts, so you actually get double the bang for your buck.
Please login or subscribe here to see the remainder of this post.


