


Top Of The World
Top Of The World
The Dow Jones Industrial apparently channeled its inner Tenzing Norgay and managed to climb to new highs at 18900 and all that without the use of an oxygen mask. The S&P and Nasdaq remained at camp IV for now but I have an inkling that they’ll make an attempt to reach the top before we ring in the new year. Clearly very few saw this one coming and the ensuing short squeeze has been a sight to behold.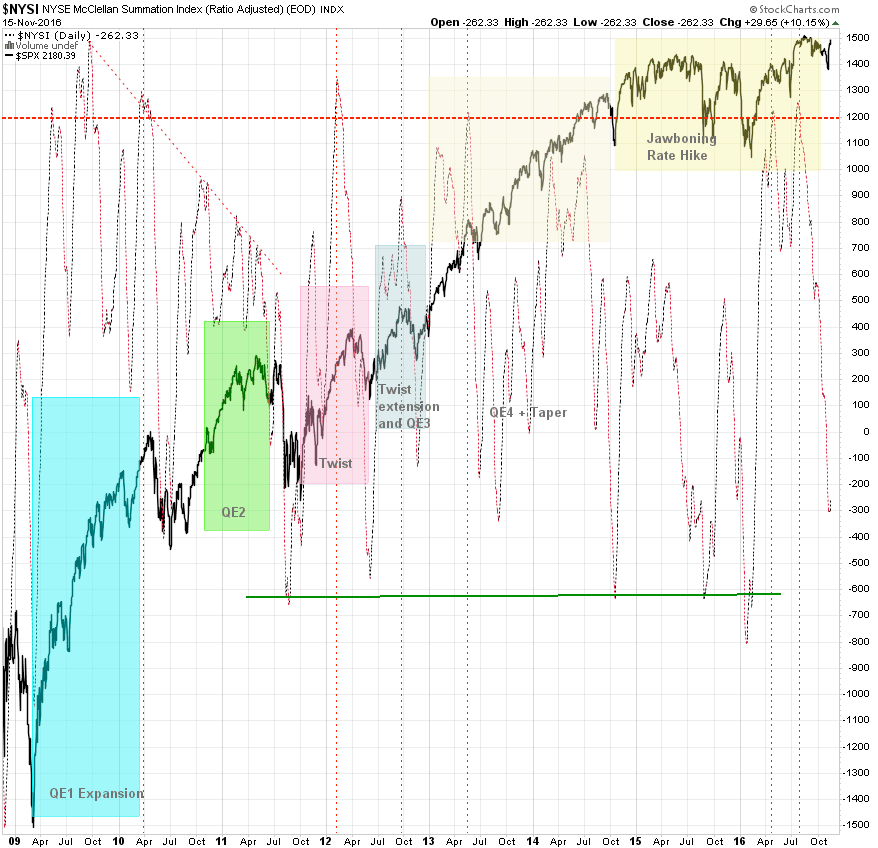
I’m planing on doing a more comprehensive momo update sometime next week but wanted to share a few select tidbits today. For a bit more context let’s take a peek at our long term NYSE Summation index. In late summer we were all primed and ready to roll over during the traditional sell off season in August/September. All our momo charts were showing us an opening and the only thing missing was for the bulls to make a move. Which happened way too late and with rather flaccid downside momentum.
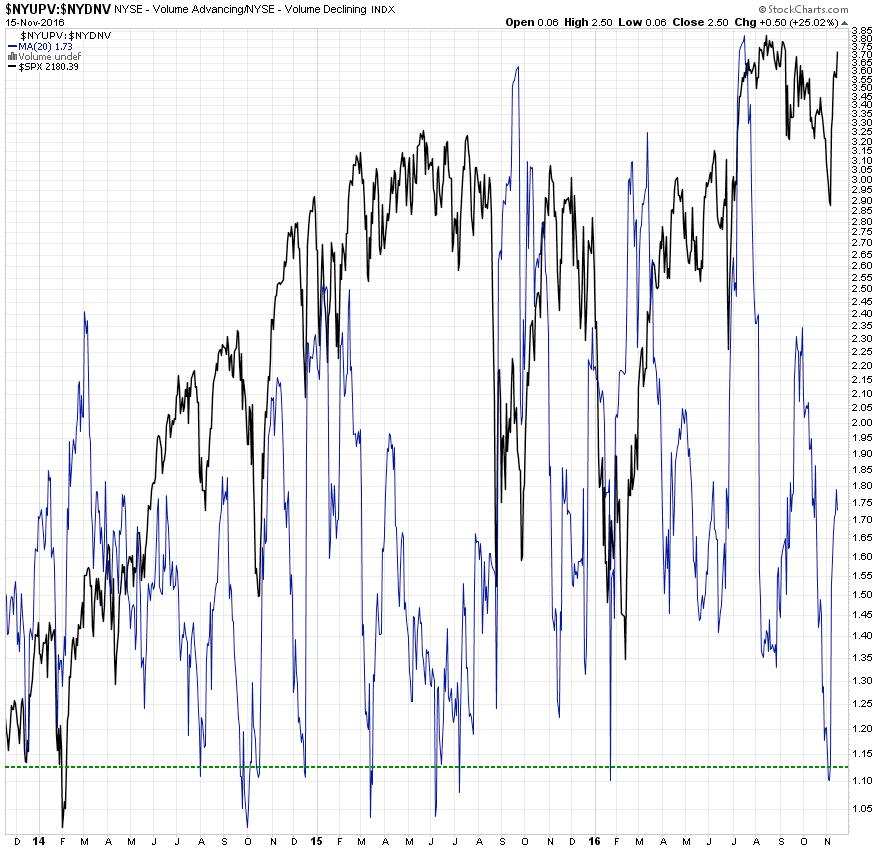
Our NYSE volume ratio shows us a similar picture. As you can see a lot of bearish momentum was (once again) wasted in sideways mode and the drop below our ~1.13 support line almost exactly marks the final lows. Quite frankly even if we had embarked onto the bearish scenario I don’t think we would have dropped all that far. Clearly there are very few bears left alive in the wild (with ground up market bear claws selling as aphrodisiacs in China) and selling interest has grown increasingly paranoid and nimble over the past few years.
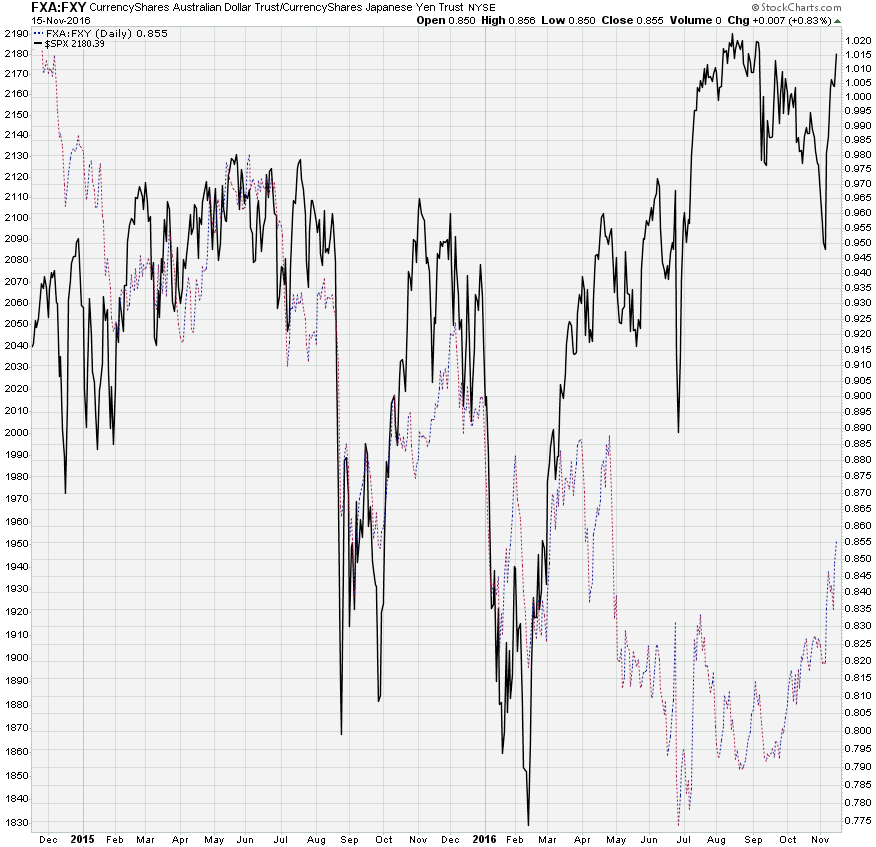
This is an old chart of mine which I had neglected a bit over the past few years. Basically it’s the ETF version of the AUD/JPY against the SPX. Don’t ask me why but the two seem to correlate extremely well and the ratio is often leading the index. As you may have noticed it is pointing up and may soon break a falling diagonal resistance line (connect the blue highs in your mind).
By the way trading along the Zero was a lot of fun yesterday and I wanted to share a recap of the break out pattern with you guys. Note how the signal remained positive through the early gyrations and then actually detached from the Zero mark (blue line in the center). When that happens I usually expect a ramp late in the session which is exactly what we got. I hope that the diagonal I painted just before was of service and that you caught a few handles of the late session burn higher.
The future is now – so don’t bring a knife to a raygun fight. If you are interested in becoming a Zero subscriber then don’t waste time and sign up here. A Zero subscription comes with full access to all Gold posts, so you actually get double the bang for your buck.


