


Two For The Price of One
Two For The Price of One
Macy’s (M) may not be anyone’s favorite place to shop these days, but its volatility curve is set up nicely for a vega crush campaign. We’re going to look at two different ways to take advantage of M’s volatility term structure ahead of earnings (tomorrow morning before open).
Macy’s
Symbol: M
Strategy: Double Calendar
Idea: Sell inflated pre-earnings IV.
When To Enter: Before 5/11 earnings announcement in the morning.
When To Exit: After earnings announcement OR we hold through expiration if there is little IV movement.
Strategy Details:
Trades to open position No. Price Total
buy 3rd June$35 Put 1×100 $0.72 -$72.00
sell 13th May $35 Put 1×100 $0.41 $41.00
sell 13th May $40 Call 1×100 $0.34 $34.00
buy 3rd June $40 Call 1×100 $0.59 -$59.00
Total $-56.00
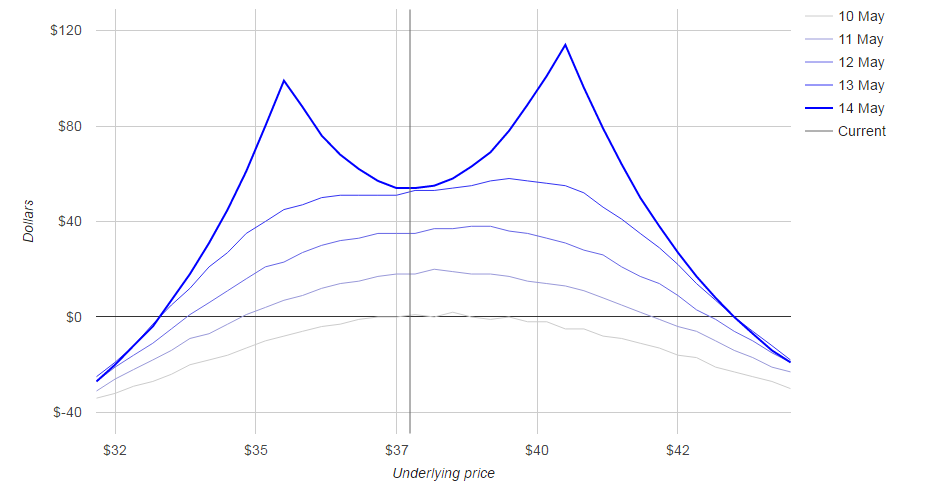
Initial outlay: $56 (net debit)
Maximum risk: $58 at a price of $25 at expiry
Maximum return: $114 at a price of $40 at expiry
Break/evens at expiry: $43, $32.80
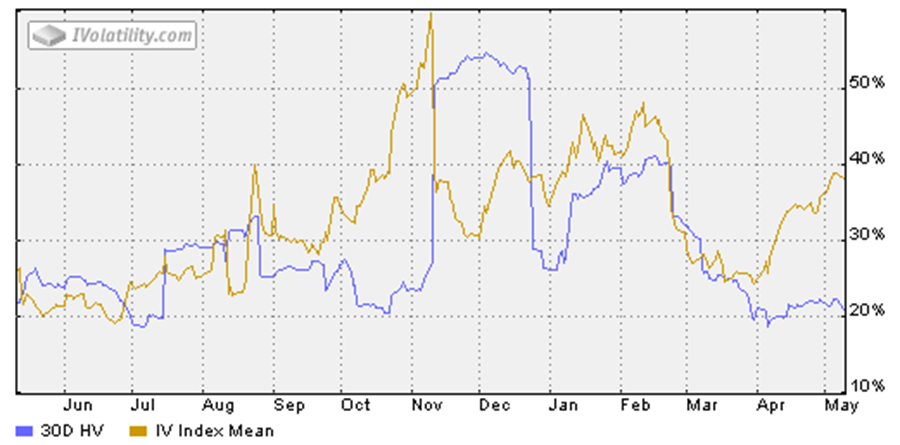
Considerations: Macy’s front month is running at close to 40% implied volatility, compared to around 20% for the 30-day historical volatility. That spread will certainly compress soon after earnings come out tomorrow morning. The double calendar is attractive because it only requires a $56 outlay, which is very close to the max risk level. Meanwhile, you can earn twice that if the stock moves to one of the short strikes and still do pretty well if the stock does nothing.
Now for a second way to play Macy’s earnings:
Symbol: M
Strategy: Limping Condor
Idea: Sell inflated pre-earnings IV.
When To Enter: Before 5/11 earnings announcement in the morning.
When To Exit: After earnings announcement OR we hold through expiration if there is little IV movement.
Strategy Details:
Trades to open position No. Price Total
buy 3rd June$32.50 Put 1×100 $0.23 -$23.00
sell 13th May $35 Put 1×100 $0.41 $41.00
sell 13th May $40 Call 1×100 $0.34 $34.00
buy 3rd June $42.50 Call 1×100 $0.22 -$22.00
Total $-30.00
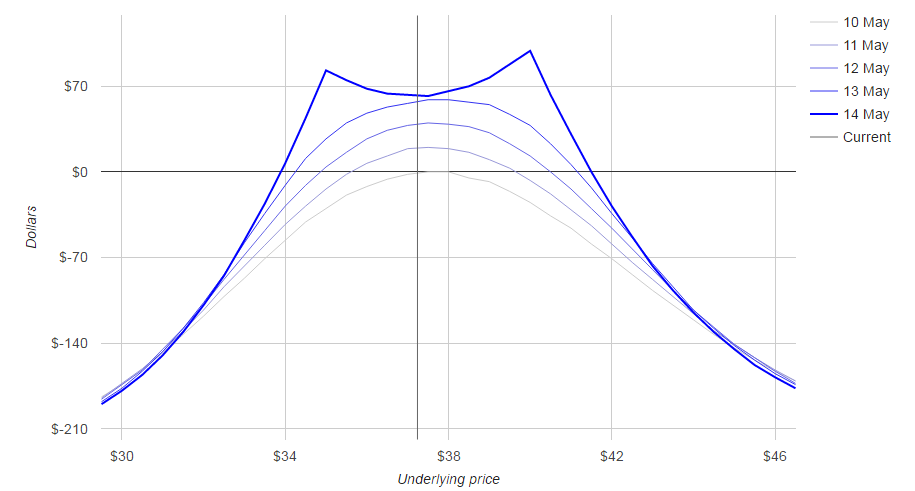
Initial outlay: $30 (net debit)
Maximum risk: $222 at a price of $22 at expiry
Maximum return: $99 at a price of $40 at expiry
Break/evens at expiry: $41.50, $33.90
Considerations: The LC strategy uses the same logic as before, but changes the risk/reward scenario. The initial outlay in only $30, but your max risk moves up (in a highly improbably scenario of course), and max return drops a bit. On the other hand, this strategy will pay off more if the stock does very little. The payoff between the max return (at the short strike) and anywhere else in the profit range is a lot narrower. In order to differentiate this strategy sufficiently from the DC, we’re using a $2.5 gap between the short and long strikes.


