


Air Getting A Bit Thin
Air Getting A Bit Thin
Things continue to progress nicely for us on the trading front and I decided to not push my luck by entering any additional campaigns today. After all correlation risk is significant in this brave QE world as currency driven moves usually affect symbols across the board. Besides everyone and their poodle seem to be bullish right now, and to once more quote the great Mark Twain: “Whenever you find yourself on the side of the majority, it is time to pause and reflect.”
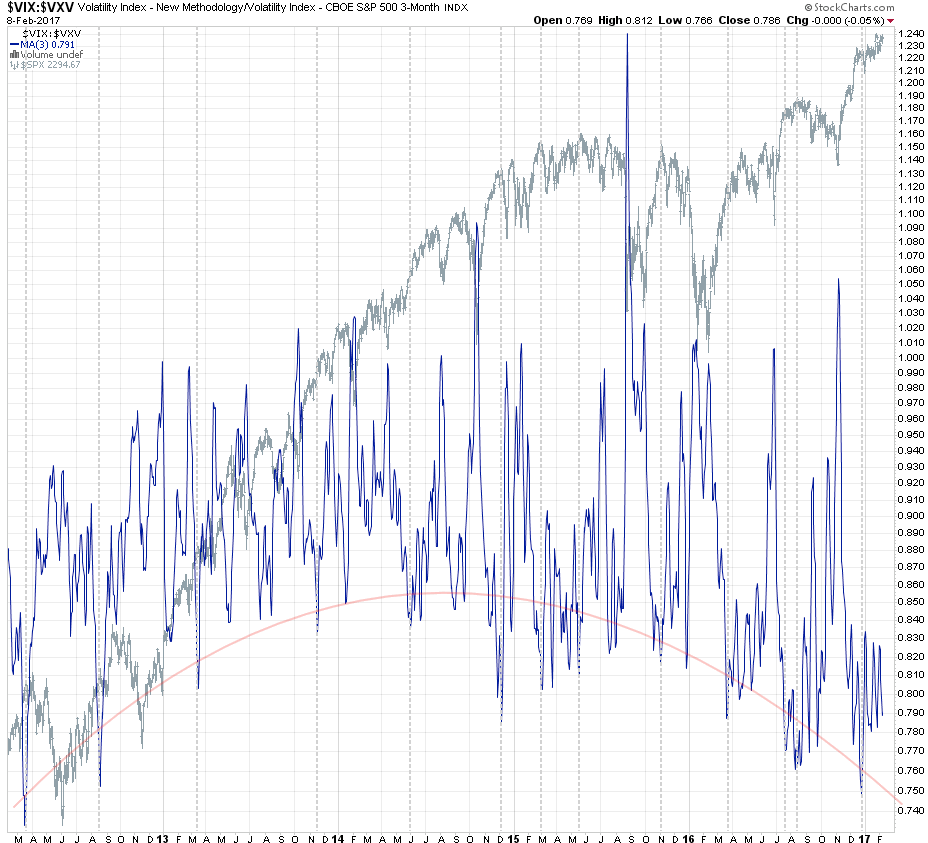
So reflect we shall, and I may as well do a little momo update then to keep you guys entertained and hopefully happily ahead of the tape. What you are seeing above is a ratio chart between the VIX and the VXV, it’s 3-month cousin on its mother’s side. The parabola I drew on it roughly traces major lows in the ratio which just so happen to correlate slightly with major highs in the SPX (shown in grey).
Your keen eye may already have noted that we breached the current threshold in late December. Which usually means that the tape continues higher for a while before it finally runs out of air and then concedes a correction of varying magnitude.

Now it’s also good to understand where we actually are on both fronts. Here’s the VXV in blue painted on top the VIX in gold. Frankly I don’t know why Stockcharts is using an erroneous scale but the real values are shown in the top left, the VIX being at 11.46 and the VXV at 14.56. So right away we can see that the VXV is over three handles above the VIX and that means market makers are anticipating a bit more long term risk in comparison with the short term, which isn’t unusual if you think about it.
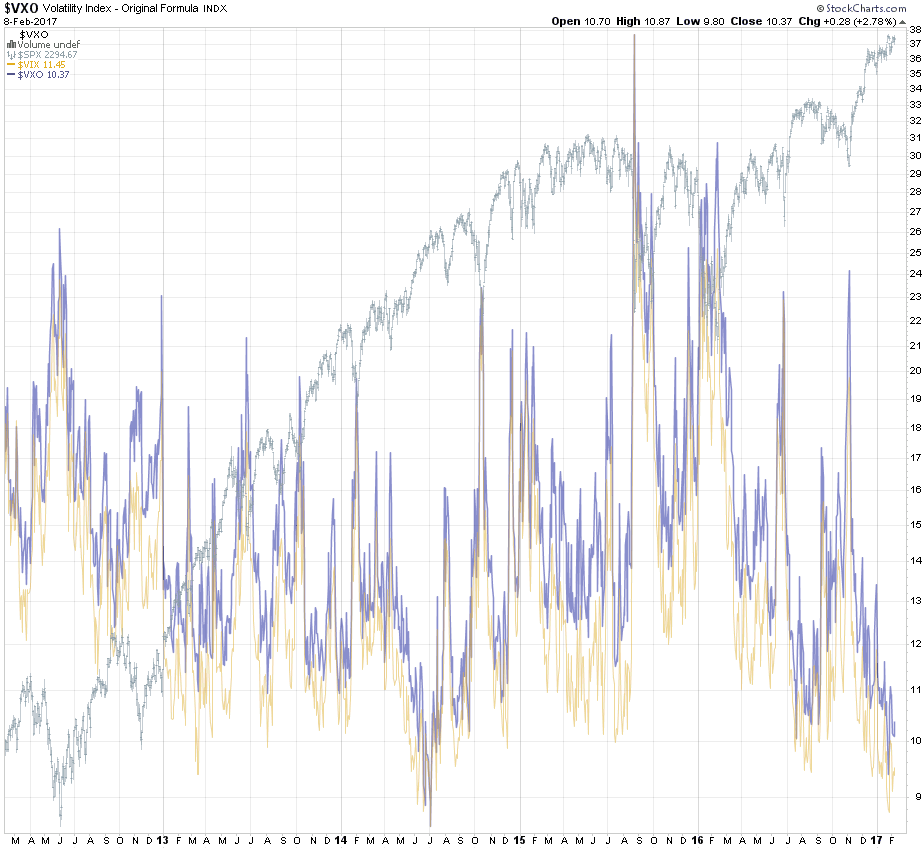
The VXO is actually below the VIX although it’s being shown inversely here – I know that’s a bit confusing but let’s just focus on the numbers. Once again there’s a delta that seems rather normal, given that the VXO focuses on strikes near at the money (ATM).
Alright so far our volatility ratio is in possible corrective territory but no immediate signs of concern. Now let’s take a look at market breadth for more evidence:

It's not too late - learn how to consistently trade without worrying about the news, the clickbait, the daily drama and misinformation. If you are interested in becoming a subscriber then don't waste time and sign up here. The Zero indicator service also offers access to all Gold posts, so you actually get double the bang for your buck.
Please login or subscribe here to see the remainder of this post.


