


Dirty Rotten Odds
Dirty Rotten Odds
I’m not going to sugar coat it for my stainless steel rats – the odds are rather iffy going into this week and navigating this tape will require a type of trader with, shall we say, a ‘unique’ set of skills.

How could you not trust faces like that? Anyway, speaking of dirty rotten scoundrels – our resident Convict Scott already pointed out a few setups earlier this weekend, so let’s cover those first:

Mr. VIX is currently sitting near the line of scrimmage and you can literally see those line backers in position and waiting for the quarterback’s final ‘hut’. I also checked some of my other more exotic volatility measures and there’s simply no clear edge right now, which means we have to be patient and wait for this tape to resolve itself.

The weekly SPX also puts both side into clear balance right now – implicitly this means that a breach of last week’s high or low will most likely lead to one side gaining the upper hand. I think you all know how to trade an inside candle at this point – if you don’t then take a peek at our cheat sheet, but don’t forget that this is a medium term trade.

If you want to get into the game earlier then look no further than this rather juicy net-lines box on the daily spoos between 1234.5 and 1275.25. Don’t forget that fair value is currently set between $-2.60 and $-2.90 in case you are projecting on the SPX.

Scott also pointed out a possible retest variation sell which is triggered on a break of Friday’s low of 1745. However the RTV Sell has a slightly lower edge, which is compensated by its bigger percentage of outlier wins (remember, platykurtotic vs. leptokurtotic – this setup would play best in the latter). Scott claims that approximately 25% of wins from this setup are > 2R, so you need to keep this in mind and trail a stop rather than use targets. Of course – whether we get it is another question altogether as I don’t really see any directional edge right now.
More medium and long term trend perspectives for the subs below:
[amprotect=nonmember]
Charts and commentary below for anyone donning a secret decoder ring. If you are interested in becoming a Gold member then don’t waste time and sign up here. And if you are a Zero or Geronimo subscriber it includes access to all Gold posts, so you actually get double the bang for your buck.
[/amprotect]
[amprotect=1,13,9,12,5]

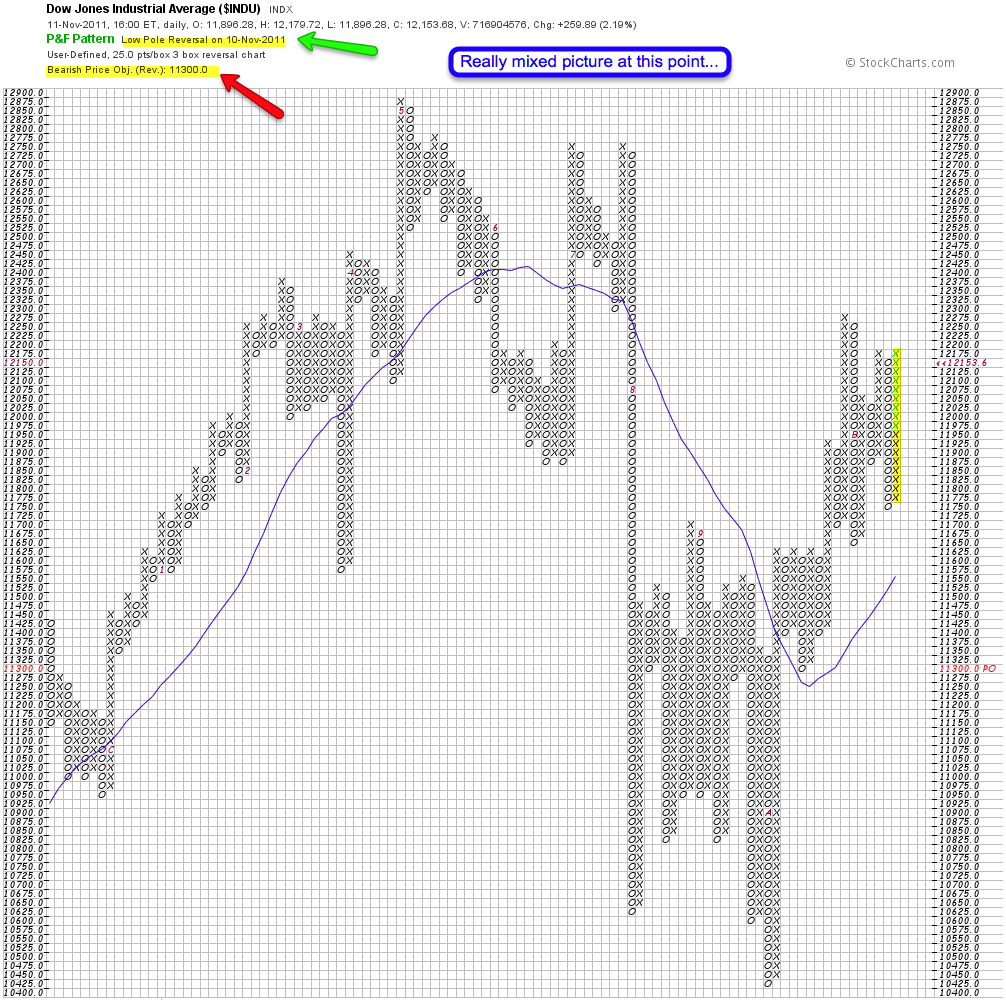
Let’s take a step back. I think this long term P&F Dow chart expresses the state of confusion in equities at the current time. In terms of seasonality we do have an upside bias but nevertheless last week brought us a furious sell off almost nobody (but me – hehehe) saw coming. While the S&P and $Nasdaq managed to reverse much of the drop the Dow was clearly steaming ahead and as of last Friday is painting a low pole reversal warning. Nevertheless, the bearish price objective of 11,300 remains in place – until of course we get a break out of the current double top.

The long term P&F on the SPX shows a clear symmetric triangle formation – and one we are about to resolve in the near future. You can run, but you cannot hide forever.

Here I changed the settings to zoom in a little bit – had I reduced the box size to 3 it would also have given me a low pole reversal. But the bearish price objective of 1180 still remains valid at this point. Unless of course we are getting more upside in the coming week.

Copper continues to look bearish however and we got a double bottom breakdown last Wednesday. It’s been pulling back a little since but the bearish price objective of 3.0 remains valid.

On the other hand we have old bucky paint a HPW while its bullish price objective of 83.5 remains intact. Of course unless it breaches 76.6, after which we’d get a bearish price objective. In general it seems that the Dollar seems to be having a hard time clearing that 21-SMA.

In terms of NYSE breadth the NYMO continues to point downward – hey, I don’t make the tape – I just report it!

NYSE volume ratio – well, it’s not looking bullish – instead rather divergent. Are we poised for another leg down before the obligatory Santa Rally? As I said – it’s not really clear at this point but looking at those charts I’d say that the bears have a slight advantage.

Silver/Gold ratio – also often a harbinger of bearish tape in equities given bearish divergences. And since we’ve got one I thought I’d include it this weekend.

And finally, the long term equivalent of the AUD/JPY – the FXA vs. the FXY. And since the AUD/JPY is our closest correlation to equities I’d say this is looking divergent as well.
Bottom Line:
Things appear at the knife’s edge again – which I have admit has been a recurring theme of mine for the past few weeks. Whenever I thought one side landed a knock out punch on a medium basis we saw a short term disruption that again changed the playing field. In terms of seasonality the bulls clearly have the home team advantage – in terms of sentiment and divergences the bears however seem to have better odds. And our final denominator – price – well, they still leave both sides an equal opportunity at this point, so we’ll have to see how this plays out. I think Scott’s weekly setup pretty much narrows it all down to one simple battle plan – be long on a break of the highs and short on a breach of last week’s lows. I’ll of course will be in touch with reports on the FX front – which in the end is really what drives equities these days.
Happy (unbiased) trading!
[/amprotect]Public Service Announcement: I made a few small changes to the ZeroFX over the weekend.

Moving forward all readings over 2.0 or below -2.0 are being truncated and you’ll get the real numbers (white and blue) printed above instead. This will prevent the ‘honey, I shrunk the charts’ effect we get on large spikes up or down and make any preceding or following signals a lot more visible. I’m also coloring any spikes above 1.5 and below -1.5 as that appears a reasonable threshold for exhaustion spike trades. If anything is unclear please let me know.
Cheers,


