


Endless Possibilities
Endless Possibilities
UPDATE 12:30pm EST: Usually Friday XIII is my lucky day – not kidding – for real. But today’s tape is boring the heck out of me. We seem to be topping but there is little participation at this point, which diminishes my confidence in picking a direction. So, I will start throwing out some of the material I was planning to post on Sunday – I’m sure you won’t mind 😉

There are three possibilities I shared with you last night. And all three of them lead us lower at this point, which is a good thing I guess if you are a short term trader. However, I play on a longer scale and the inflection point in my not so humble opinion will be around the 720 – 225 region – we might even see 710 – all based on my fib lines. This is where I see a first separation point – the second is around 785, if we get there.
How to play it is the question – do I go long or short at that level? I think we’ll have to turn to our momentum indicators to answer that question. The Zero is one I like obviously – others might resort to stochastics or MACDs – but remember to drop them into a daily chart.
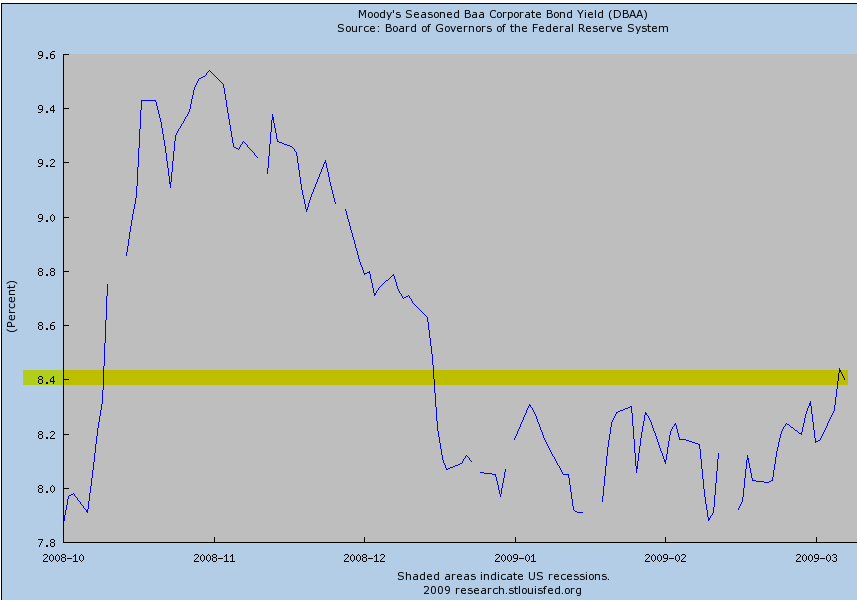
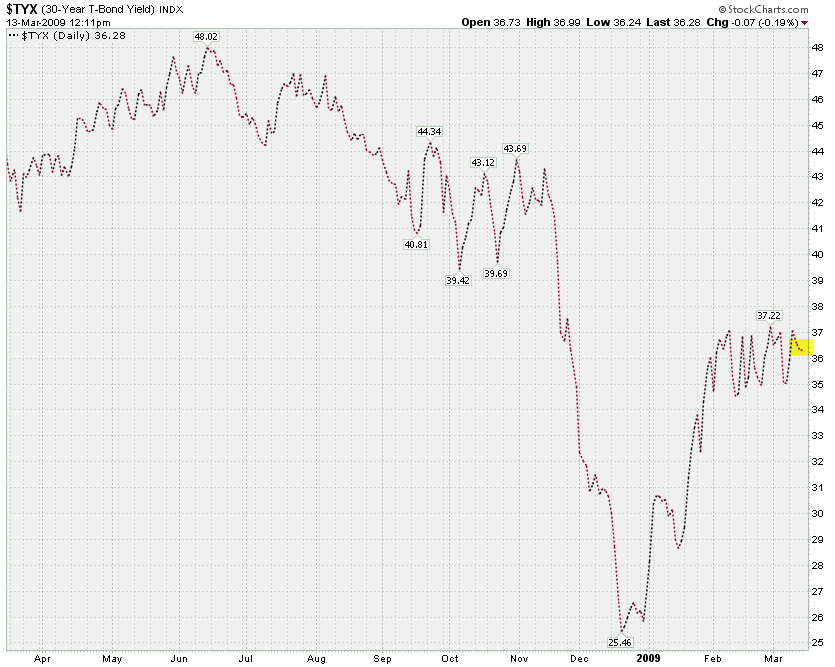
One hint may be one of my longer term indicators – the spread between the 30-year T-Bond yield and the Moody’s Corporate Bond BAA yield. On March 8th I said:
Finally, the spread between the 30-year T-Bond yield ($TYX) and the Moody’s BAA Corporate Bond yield was roughly around -4.5 on February 15 and has actually increased to -4.85. This also supports my current wave count as it has been a fairly reliable long term indicator throughout 2008. Once we see this spread decreasing it will be an early warning sign that we are nearing the end of the current Primary wave cycle.
As of March 11th – which is how far back I am able to go with those two charts above – this yield has held steady at -4.8%. To me this indicates further downside as a narrowing spread in the past preceded a longer term rally, lasting more than just a few days.

There’s also the CPC, which is currently at record lows again. We have been pushing upwards for four days now, but this is way too bullish for such a small rally. The blue arrow points at what happened last time after seeing such low readings.

However, what disturbs me is the reading on the NDX – it pretty much smashes our bearish potential. Either 4 of (5) is still in the works or Primary {1} of c ended quietly and we are already in Primary {2}. Frankly, I need to give this some thought over the weekend – in the meantime I am keeping my exposure very light.
Alright, I’ll leave it at this for now – the weekend forecast will be a tad shorter but it seems we now have time to digest some of this info, discuss/debate/argue it among ourselves and perhaps find some strategies that maximize our chances for negotiating this tape successfully whilst incurring least amount of risk.


