


February Market Momo Update
February Market Momo Update
One of the reasons why I entertained the mere notion of an E-Mini long campaign over three weeks ago was that, while market momentum certainly appeared to be maturing, there clearly was plenty of remaining potential for a continuation of the advance. Or in other words, don’t ever trade against a rally just because in your infinite wisdom you have come to believe that it has gone far enough. Lacking any clues to the contrary always stick with the ongoing trend.
Now I’m pretty sure that this is a trading nugget you have seen in several of the trading books you have accumulated over the years. But unlike many hobby analysts or ivory tower academics this market megalomaniac is more than prepared to deliver actual evidence in the form of momo charts. So strap yourself in as we’ve got a lot of material to cover and it’s going to get rowdy.
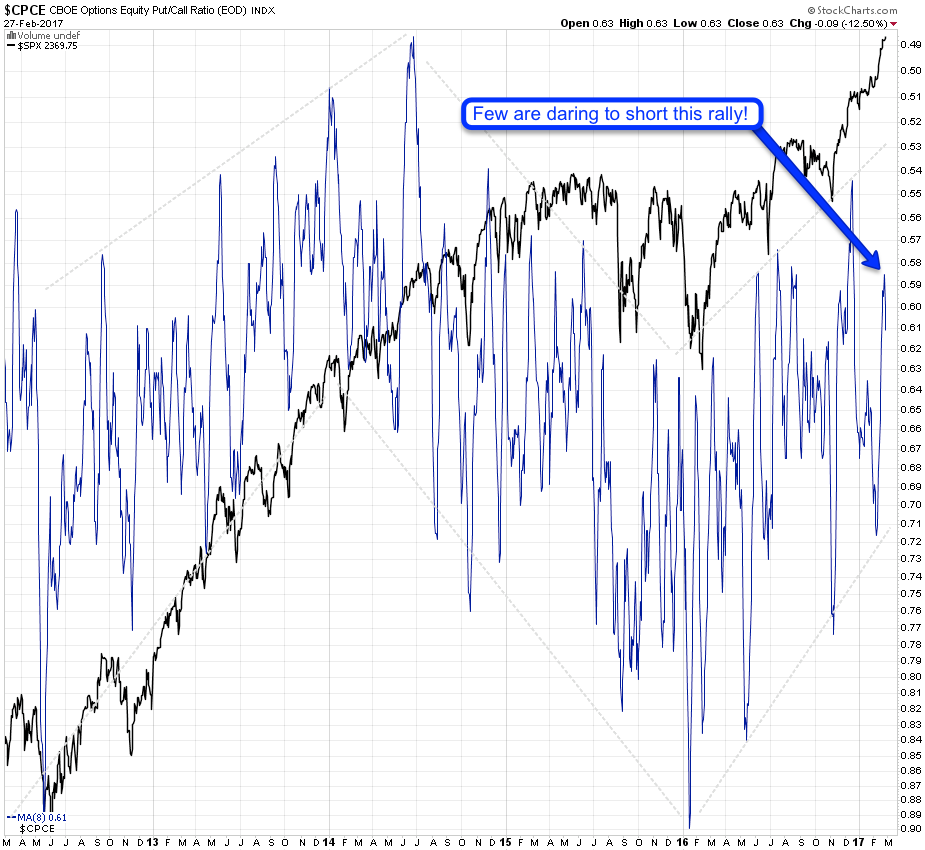
Alright, I’m dropping you right into the deep end of the pool here. The CPCE was one among many warning signs a month ago which strongly cautioned against shorting this market. The zigzag channel I have drawn shows us a slightly smoothed put/call ratio that tells us a lot about market sentiment. Earlier this month we actually had DROPPED toward the current lower boundary, which usually only accompanies a corrective phase.
My take then was to watch out above because nothing is more dangerous to the bears than a lack of shorting (or in this case put buying) interest during a sideways market (referring to the January period). Going forward you may once again be surprised to learn that I am still not ready to call it quits on this rally. One among several reasons is that the put/call ratio continues to reflect very little appetite.
Caveat
I however consider it my duty to point out right from the get-go that markets like these can become extremely dangerous. Meaning if a relentless advance such as this continues to be ignored by early sellers then we may actually run into a situation in which we are simply running out of buyers. When that happens a very violent downside correction is often the result.
What this means for you right now is that you should continue riding this rally as far as you possibly can but I would very much caution everyone against hopping on this ride this late in the cycle.
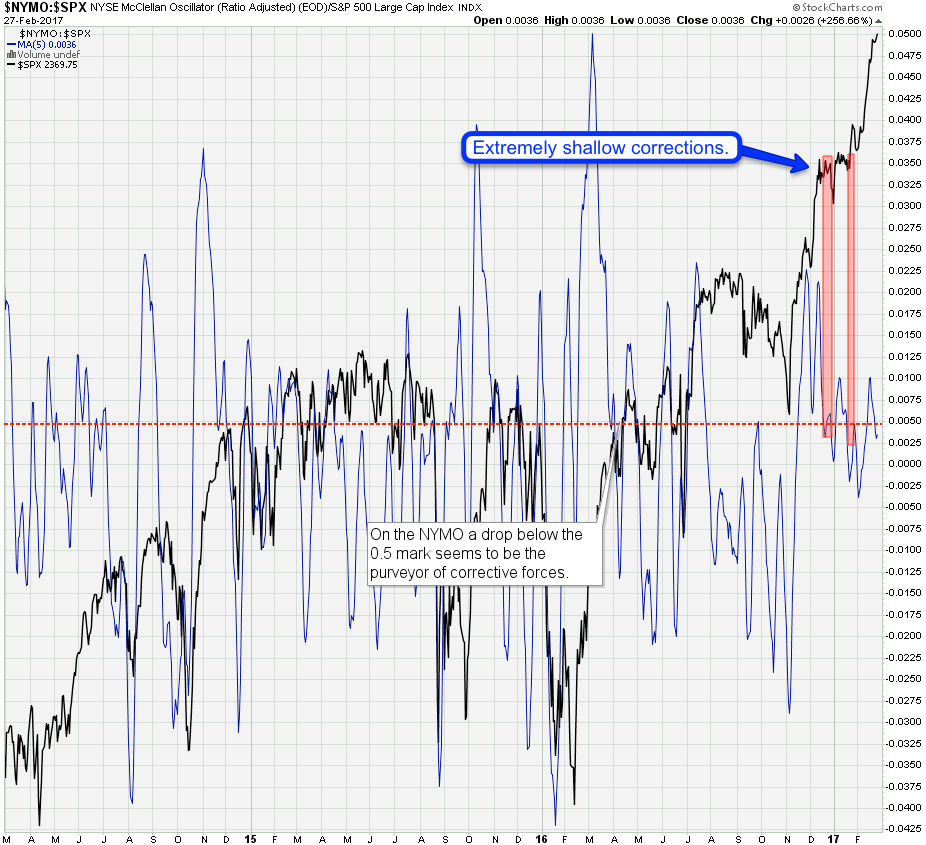
Alright, but we are just getting warmed up. The NYSE McClellan Oscillator is a breadth measure that is based on the number of advancing vs. the number of declining stocks. I use it a bit differently than most in that I do not care about the actual reading but the direction in combination with an SPX based ratio threshold at 0.0050. I have found that a breach below the mark in most cases is followed by an intermediate correction.
But what really gets my attention is when the opposite happens and in particular if it happens twice. Which is what we got in the sideways January phase before this current leg higher. A breach of the previous highs in the SPX after a dip below this ratio strongly suggested that the bears were heading for the reaming of their already miserable existence.

Another breadth measure is the simple SPXA50:SPXA200 ratio which does not use any moving averages or complicated formulas. Once again I am looking for direction (intent) and a threshold (the inflection point). Here the 1.0 mark usually precedes a corrective phase and that’s what we saw in January. My take then was to not call a top but to start looking for reversal signs. Which never came. Once again a breach of the previous highs on the SPX told us that we may be looking at a runaway train here.

Another version of the same is the NYA50:NYA200 – very same idea although we are talking about 2,800 symbols here which gives us a very broad and often lagging perspective. A breach through the 1.0 mark for me usually is an early signal that the easy phase of the rally is over and that a correction may be around the corner. But of course not always and I never ever base my trading solely on breadth measures.

Okay, one more goodie before the pay wall: Here’s the VIX in all its vanilla glory on top of its rate of change indicator. I use a 12 interval in combination with thresholds to parse for what I call the VIX Volatility Expansion Rule (please – I need better name for that!), which goes like this:
- The ROC(12) must have previously dropped to -40.
- The ROC(12) must touch or breach the 0 mark
Once the two conditions have occurred we usually see a spike in the VIX to > 20. Now the timing may be slightly delayed or it may happen quicker than we thought. But the bulls are clearly on notice now.
Plenty more goodies below the fold. Please join me in the lair:

It's not too late - learn how to consistently trade without worrying about the news, the clickbait, the daily drama and misinformation. If you are interested in becoming a subscriber then don't waste time and sign up here. The Zero indicator service also offers access to all Gold posts, so you actually get double the bang for your buck.
Please login or subscribe here to see the remainder of this post.


