


How To Thrive In Bear Markets – Part 2
How To Thrive In Bear Markets – Part 2
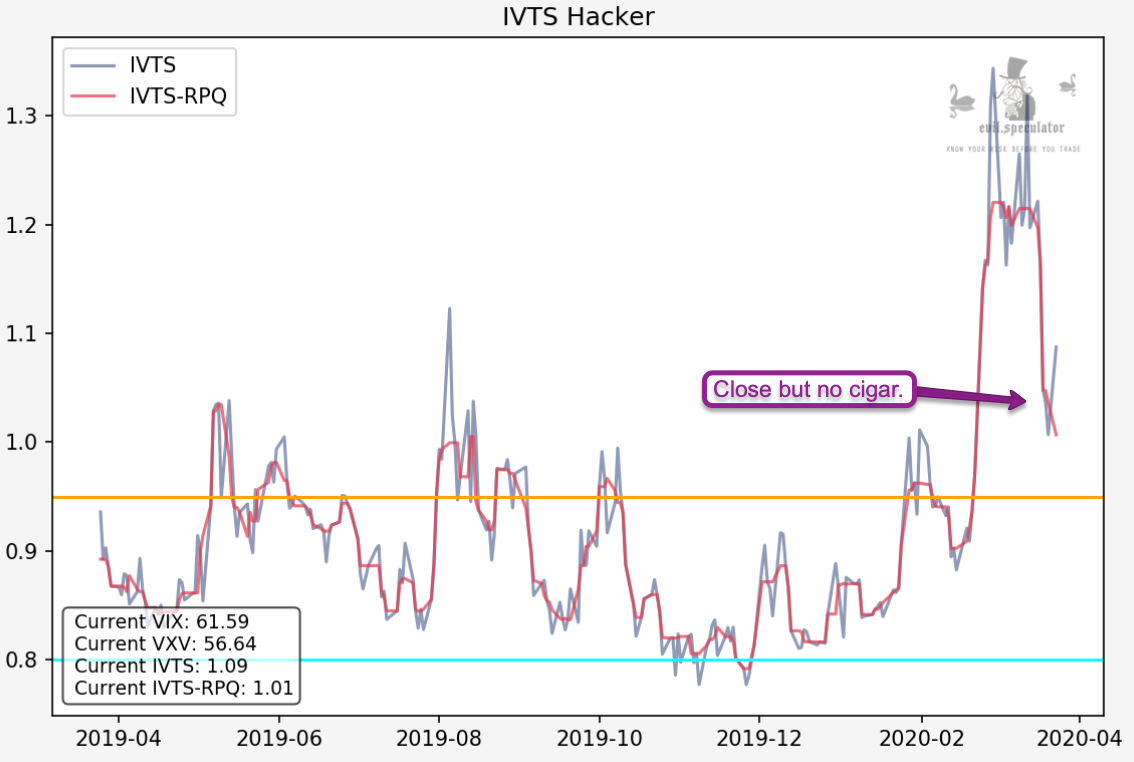
In part 2 of this series I am going to dumb down a key aspect of bear markets that has largely remained unknown to the vast majority of retail traders. It is important to embrace the fact that while the gray unwashed masses focus solely on the daily gyrations of the VIX professional traders instead religiously follow an exotic construct called the Implied Volatility Term Structure (IVTS).
There are several incarnations of the IVTS. The one Tony and I use (and which we’ve covered here in the past) is a ratio of the VIX vs. the VIX3M (formerly called the VXV). Some traders instead use two VX futures as their ratio which in most cases boils down to the front month contract versus the month that follows.

As of right now that would be April versus May. The chart above shows an hourly and daily panel of the former, but I have scrolled forward a little to show that the VX futures roll over every month.
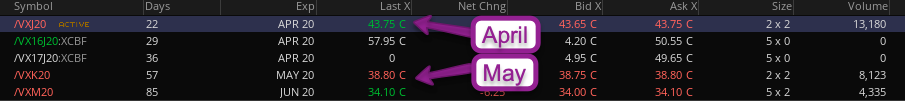
A more convenient way to look at various VX contracts side by side is to pull up /VX in ThinkOrSwim in the trade tab and then select ALL in the dropdown next where it says ‘futures’.
The two labels point at the front month (April) and the one that follows which is May. As you can see there is a LARGE delta between those two as April hovers near 44 with May at slightly below 39. If you divide April by May you get to 1.125.
Which is slightly higher than our VIX:VXV ratio which currently stands at 1.09, but both can be averaged out to about 1.1, which is the number we should be mostly concerned about as it represents the central theme of this post.
What is important to understand is that the IVTS offers hidden clues as to when equity market bottoms are visible. Under normal circumstances (i.e. sans a bear market sell off) the term structure of the VIX (how the price of the VX contracts relate to the spot) is normally in contango (upward sloping), meaning that VIX futures have a higher price than the spot price (i.e. the VIX).
This effectively means that the futures market on average is pricing that volatility will RISE from current levels (or FALL if you invert the graphs shown below). Now another important aspect of the term structure that most retail traders are unaware of is that the premium to spot has historically been too high relative to the subsequent realized volatility.
Which means that institutional traders and smart pros like Tony have banked quite a bit of ill gotten coin by shorting longer term VIX futures contracts which then roll down and produce a positive roll yield.

At this point your head is probably in TILT (an old pinball expression for you kiddos) which is why I sat down and produced the two comparison graphs you see above. The left graph shows a typical scenario you would find with the VIX elevated but not in bear market mode.
The values I entered are imaginary but represent a good approximation of what you should usually expect. As you can see the contract expiring in four months is quite a bit more elevated than the ones that expire afterward. And from there it works its way down toward the spot price. That is considered the ‘normal / bull market’ scenario.
Pro traders also talk about SKEW which relates to the shape of the curve, i.e. how steep it advances or declines in contango and backwardation. It’s interesting to understand but does not lie at the core of this post.
Upside Down World
Instead your focus should be on the second graph which I produced by lifting the current prices of the next four futures contract going into July. So what you are looking at is the VX term structure as it applies right now and right here.
The current situation represents a complete inversion of what is considered a ‘normal’ scenario. And this means that the steep backwardation (downward sloping) creates a tailwind for being LONG instead of being short volatility.
When the VIX futures term structure (or our VIX:VIX3M ratio) below 0.92 is typically considered positive equity markets. Anything above 1.1 is clearly puts us into bear market territory. As most clients find it difficult to follow these contracts we have produced the IVTS tracker I have posted above.
Take Away
No matter which VIX term structure you use, futures or index basked, the resulting ratio can provide you with very important clues as to the ‘mind’ of the market as it represents true sentiment expressed by traders via the VIX futures (i.e. various VX contracts) and option markets (which both the VIX and VIX3M are based on).
It represents a much better gauge than lines on a chart which are almost guaranteed to be ignored during high volatility bear markets.


