


Let’s Crush Some Volatility
Let’s Crush Some Volatility
If like me you were a Monty Python addict back in the days then you are probably familiar with the phrase ‘And now for something completely different’. As you probably know we’re in the midst of Q2 earnings season right now, and Jay The Executioner in collaboration with yours truly has been on the hunt for potential IV crush victims. To a seasoned option trader earnings season is tantamount to Christmas but four times a year. Because just like moths are invariably drawn to the flickering lights of a burning flame, retail traders can’t help themselves but accumulate overpriced options in hopes of guessing the resolution of earnings reports. And being the hapless amateurs that they are they mostly think of options in a 1-dimensional way – and that is limited to only price variation: up or down. However options happen to be multi-dimensional derivatives which requires multi-dimensional thinking.

Sure, that all sounds really easy Mole. Let me check back with you once I get my PhD in quantum physics then, alright?
No worries – we’ll get you there one step at a time. For starters if you haven’t already then I suggest you catch up on the first three installments of our option tutorial series. It’ll get you up to speed on basic option theory, the greeks, and most recently I covered the various benefits of vertical spreads in comparison with naked options.
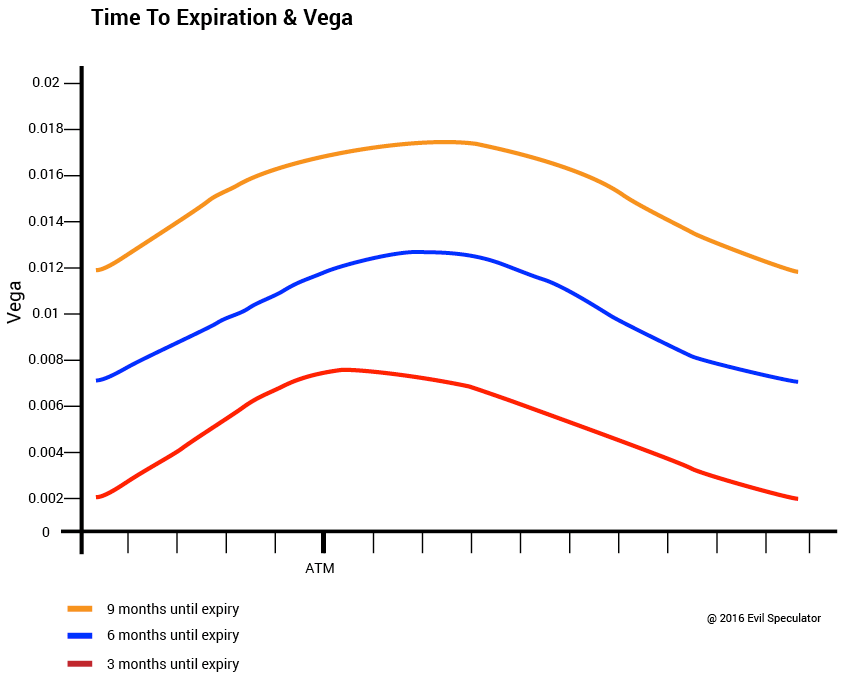
One of the advantages I mentioned was reduced exposure to theta burn. We also know from the tutorial covering the greeks that volatility does affect options quite a bit. If you look at the graph above then you see that vega is highest in options that have more extrinsic (i.e. time) value. Therefore an April option with a strike at $50 has a lot less vega than a June option with the same $50 strike. In general the rule is that the more time remaining to option expiration, the higher the vega. You can also see in the graph above that the longer term options show a vega peak a bit OTM the money whereas the near term one peaks vega near the ATM point. Just keep this in the back of your mind for now.

The second vega related graph I posted was this one which depicts how a rise in volatility affects the extrinsic value of an option in general. It very distinctly depicts the mechanism that serves as the basis for the phenomenon we call vega crush. And this is how it works:
Fear Multiplied By Time Equals Volatility
During earnings season volatility on front month options often increases significantly as investors/traders anticipate more volatility due to uncertainty about the companies representing the stocks they are trading. That increases what is called SKEW on the option smile – again a topic we covered here in the past but will revisit again in the near future. For now remember when it comes to derivatives like options the game is all about anticipation of price, time, and volatility. We are banking on the fact that the latter, volatility, will be grossly inflated. In fact when selecting our symbols Jay and I specifically were looking for a large difference in historical vs. implied volatility. If it’s overpriced – we want to sell it.
The Cat Is Out Of The Bag
Now once the earnings report is out price has either moved up, down, or not at all. Attempting to predict one of those three options either requires insider knowledge (illegal cough cough) or a crystal ball (not sure they are illegal). There is one component of options however that is highly predictable and that is volatility. And in almost all cases, except extremely disastrous news about the company perhaps, is the direction vega will take after the earnings announcement, and that is down.
So here’s an idea – why not try to trade vega instead of price? Well, indeed – why not?
Learning How To Swim
The inimitable Bruce Lee is credited with saying that ‘you can’t learn how to swim standing at the beach‘. So I’m just going to throw you all into the proverbial water here and see what happens. I was originally planning on posting option related setups after at least having covered credit spreads and condors but I think you know enough to be dangerous and perhaps play along just paper trading for the moment.
There are probably a myriad ways of how to play vega crush but we’ll introduce two of them today. The first one is a double calendar spread and the second is a bastardized version of an iron condor which I don’t know whether or not has a name and thus I called it a ‘limping condor’. Both take advantage of calendar spreads which are also known as horizontal spreads as the vertical option chains of various expiration months used to be listed horizontally on a big board back in the olden days. We haven’t covered calendar spreads here yet but will do so in the near future – for now just know that calendar spreads are either aimed at exploiting either differences in time value (measured by theta) or volatility (measured by vega) which implicitly affects theta.
The Idea
Both strategies will attempt to sell inflated vega in front week options and at the same time limit our risk by buying back front month options which we expect to be less affected by vega crush. That’s a more short term variation on the same popular theme which involves selling front month options and buying more longer term options, e.g. contracts expiring three to six months out.
The Victims
Jay and I have parsed a number of symbols which expire this week and selected Facebook (FB) and First Solar (FSLR) as our first two victims. For the purposes of exploiting IV crush we will be selling weekly April options which expire in a few days and at the same time buy back May options which expire in about a month from now. So those are just about to fall off the plate in the theta department. Clearly we are not planning to hold either strike for very long. The time window of both of these strategies is one day to a few days – the maximum is Friday when the April options expire.
Symbol: FB
Strategy: Double Calendar
Idea: Sell inflated pre-earnings IV.
When To Enter: Before 4/27 earnings announcement.
When To Exit: After earnings announcement OR we hold through expiration if there is little IV movement.
| Action | Strike | Type | Premium | Price |
|---|---|---|---|---|
| Buy 1 | 20th May $102 | Put | $1.69 | -$169.00 |
| Sell 1 | 29th Apr $102 | Put | $0.93 | $93.00 |
| Sell 1 | 29th Apr $118 | Call | $0.88 | $88.00 |
| Buy 1 | 20th May $118 | Call | $1.61 | -$161.00 |
| Net Debit | -$149.00 |
Initial outlay: $149 (net debit)
Maximum risk: $154 at a price of $75.60 on day 26th Apr 2016
Maximum return: $304 at a price of $118 at expiry
Break/evens at expiry: $126.20, $95.50
Considerations: We are betting on a significant decrease in front month IV, which is extremely elevated compared to recent levels of realized volatility (see historical IV chart comparison below). The front month straddle in this case is expecting a roughly $8 move, which is where we set our short strikes. We looked at the limping condor here as well, but the double calendar made more sense as your initial outlay is almost identical to your max risk. Max return meanwhile is double the outlay. Keep in mind, you don’t start losing money on this trade until the stock climbs above $126.2 or falls below $95.50 – a highly unlikely scenario by week’s end.
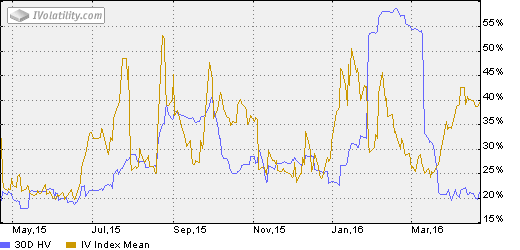
The difference in historical vs. implied volatility in FB right now is about 20%. Juicy.
Symbol: FSLR
Strategy: Limping Condor
Idea: Sell inflated pre-earnings IV.
When To Enter: Before 4/27 earnings announcement.
When To Exit: After earnings announcement OR we hold through expiration if there is little IV movement.
| Action | Strike | Type | Premium | Price |
|---|---|---|---|---|
| Buy 1 | 20th May $52.50 | Put | $0.76 | -$76.00 |
| Sell 1 | 29th Apr $54 | Put | $0.62 | $62.00 |
| Sell 1 | 29th Apr $66.50 | Call | $0.61 | $61.00 |
| Buy 1 | 20th May $68 | Call | $0.81 | -$81.00 |
| Net Debit | -$34.00 |
Initial outlay: $34 (net debit)
Maximum risk: $236 at a price of $36.55 on day 26th Apr 2016
Maximum return: $221 at a price of $66.50 at expiry
Break/evens at expiry: $71.45, $51.60
Considerations: We are betting on a significant decrease in front month IV, which is extremely elevated compared to recent levels of realized vol (again see the graph below). The front month straddle suggest the stock will move less than $6 in either direction by the end of the week. Given that scenario, selling the wings makes perfect sense at these price levels. We also priced out a double calendar but felt low cost of the initial outlay made this Limping Condor a better trade candidate.
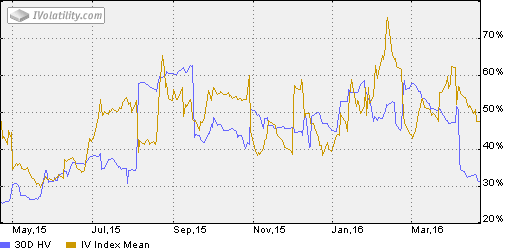
Here we apparently also have a ~20% delta between historical and implied volatility. That is what we want to see and that is what we’re selling.
Theory Vs. Reality
Nothing in trading is ever a sure bet, and that prime directive also extends to the world of option trading. A lot can happen between now and expiration but condors and calendar spreads in general are known to be high probability but low return strategies, if selected and managed properly. Those returns however can increase quite significantly when taking advantage of volatility changes, so let’s just see what happens. Jay The Option Executioner will also be monitoring the board today, so if you have related questions blast away! We’ll be trading these setups on our end and then report back with the results – either the day after the earnings announcement or when the weekly April options expire.


