


Let’s Crush Some Vega
Let’s Crush Some Vega
The only thing that retail traders love more than earnings season is to endlessly debate the direction of how each issue may resolve. Now if you intent to BUY stock at a discount then waiting for a negative announcement and purchasing shares before the rebound can – on average – work out famously during bull markets. However when it comes to profiting from earnings via speculation the name of the game is not to pick a direction, rather it’s to profit from a large stock price move no matter the direction.
During high volatility periods such as right now there is much potential in benefitting from inflated implied volatility ahead of earnings. There are several option strategies that achieve this but let me introduce one of our favorites today which is a short calendar spread.
Summary
A short calendar spread is created by selling a longer-term option and buying a shorter-term option of the same series (calls with calls and puts with puts) at the same strike price.
This strategy is established for a net credit and both the profit potential and risk are limited (if managed properly). Max profit will be realized if the stock price is far above or far below to the strike price on the expiration date of the long option.
Inversely max risk is assumed if the stock price does not move post earnings and thus remains at the strike price. So whatever stock we consider our main criteria is the potential for a considerable move away from the strike price.
Max profit
The max profit of a short calendar spread is the net credit received less commissions. This profit is realized if the stock price is either far above or far below the strike price of the calendar spread at expiration of the shorter-term long option.
No matter if the the stock rises or falls – if it moves sharply away from the strike price then the value of both options cancels each other out and we get to keep the entire credit.
Let’s say for example the stock falls sharply, then the price of both options approaches zero for a net difference of nil. On the other hand if the stock price rises sharply so that both options are deep ITM, then the real value of both options approaches parity and once again the net difference is nil.
Max risk
The potential max risk of a short calendar spread is unlimited if the shorter-term long option expires worthless and the longer-term short option remains open. Basically one would have to be asleep at the wheel and therefore it is crucial to close the spread ahead of the expiration date of the shorter-term long option.
Assuming you completely snoozed and kept the long option, the maximum risk of a short calendar spread occurs IF the stock price equals the strike price of the spread on the expiration date of the shorter-term long option.

This is the point of maximum loss, because the short option retains maximum time (extrinsic) value when the current stock price equals the strike price (as shown above in the graph). Remember that the real (intrinsic) value of both options cancels each other out in both long and short calendar spreads.
Also, since the shorter-term long option expires worthless when the stock price equals the strike price at expiration, the difference in price between the two options is at its greatest. An ATM option at expiration has zero time (extrinsic) and zero real (intrinsic) value.
It is impossible to know for sure what the maximum loss of a calendar spread will be, because it depends on the price of the short option which in turn can vary based on IV.
Break-even
There are actually two breakeven points, one above the strike price of the calendar spread and one below. Here things get a bit fuzzy but let me try to explain this:
On expiration day both breakeven points mark the point where the time value of the longer-term short options equals equals the original price of the calendar spread. It’s not an exact science however, since the time value of the short option depends on the level of implied volatility.
Thus it is impossible to know for sure exactly what the breakeven stock prices of a short calendar spread will be. However there is a way of estimating it very very well, which is a technique I’ll be teaching in the upcoming Options 201 course that I’m in the process of completing.
Now the best way is to learn by example. I’ve picked three symbols from last Friday’s run up – they all report either on Wednesday or Thursday and they all show highly elevated IV in the front-week expiration contract that expires this Friday.
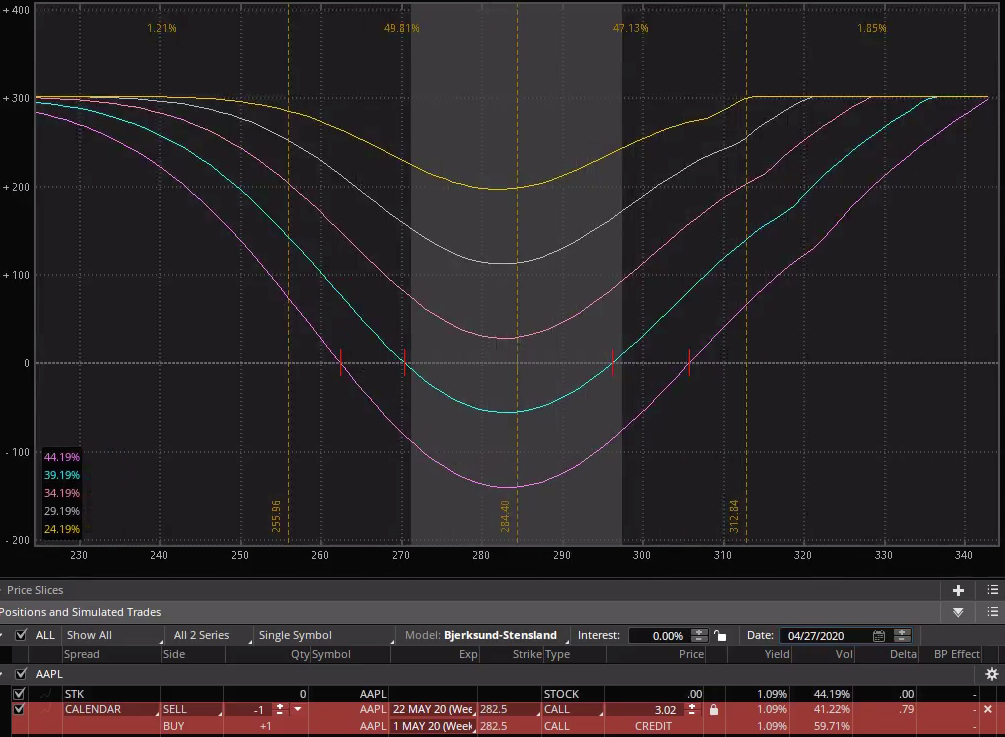
First runner up is AAPL – what else – which reports on Thursday and currently dons a mild IVZ-score of 0.64. However there is nearly a 10% delta between the May 1st and May 22nd expirations. The proposed play is placed ATM and probably will have shifted by the time you read this.
I am not a big fan of profit/risk graphs when it comes to options but they are great for showing the impact of implied volatility on the potential profit or loss of a strategy. Remember that the entire purpose of the exercise is to benefit from volatility or vega crush.
The IV intervals show us five graphs – each with a difference in IV of -5%. Clearly the more a drop in implied volatility the more we make bank.
More vega victims below the fold for my intrepid subs:

It's not too late - learn how to consistently trade without worrying about the news, the clickbait, the daily drama and misinformation. If you are interested in becoming a subscriber then don't waste time and sign up here. The Zero indicator service also offers access to all Gold posts, so you actually get double the bang for your buck.
Please login or subscribe here to see the remainder of this post.


