


Living Inside a Broken Clock: Thursday, Dec. 31, 2009.
Living Inside a Broken Clock: Thursday, Dec. 31, 2009.
by gmak
Happy New Year, or other Pagan festival of your choice!
Here is the game being played by Treasury, the FED, FCBs, and the political uberclass. It can only end in tears.
http://www.youtube.com/watch?v=tbq7GM9hBQo
Japan has huffed and puffed and inflated debt to GDP to a possible 200%, to no avail. Take warning those who believe that the FED can reflate a multi-trillion dollar hole in the balloon. Here is one take on Japan’s latest efforts as they try once again to push through the burning forest.
http://www.calculatedriskblog.com/2009/12/japan-twenty-years-later.html
Here is what, for now, is the definitive over-kill of charting inflation – using PPI and CPI-related measures – and well worth a look-see. IMHO, this is only one part of the story since inflation is ALL money divided by ALL goods, services, and ASSETS. However, we are seeing some upward price pressure.
http://www.financialsense.com/Market/griess/2009/1229.html
If credit is still contracting, then that extra money being spent at the producer and consumer level is coming from somewhere else – perhaps savings (and Asset prices). Here is an example of how the credit contraction is showing up. Those credit card write-offs are “money” that has now disappeared from the system.
http://globaleconomicanalysis.blogspot.com/2009/12/credit-card-delinquencies-chargeoffs.html
This is in spite of the massive expansion of the FED’s B/S. Notice in the chart how the expansion is under pressure. That attempt at credit creation is NOT making its way into the hands of the private sector and households. Remember that the MBS expansion – which is what has been driving the FED’s B/S expansion lately – is running out, and expires in March. A crisis is needed for this to continue.
http://dailyreckoning.com/the-mother-of-all-balance-sheets/
Wages and benefits are also under pressure, which begs the question ask to where the money for growing PPI and CPI is coming from. A reduction in benefits affects total income and disposable income. Either money is shifted from one area to another (i.e. from TV to medical benefits) or savings are increased (to replace declining pensions), or the reduction in benefits results in a decline in expenditures in that area which reduces the income for those working in that area, and the vicious cycle continues.
http://globaleconomicanalysis.blogspot.com/2009/12/union-battles-in-las-vegas-simi.html
Will the world save the US? Northern Trust has everything you care to know about global economic growth. In a nutshell, they say that it will be staggering (no doubt under debt levels) upward slowly. They do mention the credit contraction but don’t really address how this impacts the growth story. Continuing weak unemployment, credit contraction, are supposed to be offset by growth elsewhere in the world. How many pyramids can China build?
http://www.safehaven.com/article-15333.htm
http://www.youtube.com/watch?v=0h7V3Twb-Qk
What seems to be driving current growth, and the stellar Chicago PMI index result could be inventory re-building. The theory is that inventory rebuilding to long run norms means jobs for those where the inventories are being rebuilt. Those jobs mean more disposable income = more spending = more jobs in those sectors where the spending occurs to keep inventory levels going. The fly in the ointment is if the consumer does not spend but saves instead, or pays down debt. This blog saves me from having to cut and paste a whole bunch of charts. Remember, the inventory rebuild is only temporary GDP growth unless extra disposable income is created and actually spent on consumption – not on credit contraction. For the record, I find the GDP projections laughable, especially given the superficial treatment using seasonally-adjusted numbers.
http://accruedint.blogspot.com/2009/12/2010-forecast-hows-gas-mine-is-it.html
The PMI numbers are not what they seem and are (as usual) fudged with seasonal adjustments. I think that it’s best to look at non-SA YoY changes, not MoM or QoQ seasonally adjusted.
http://market-ticker.denninger.net/archives/1803-Chicago-PMI-Look-At-The-Comments.html
And it looks like the consumer is not buying into the “good times are here again” spin in the media. It seems the consumer is pulling their collective head back into the shell.
And tax revenues are showing this, to the consternation of local and state governments everywhere.
http://online.wsj.com/article/SB126212283240009387.html?mod=WSJ_hps_sections_news
Here is a small break for amusement. We all need a bit of a chuckle about now.
http://www.nypost.com/promos/covers.htm
EQUITY
I read the news today, oh boy! Unemployment hits its lowest level since July 2009. Now I’m looking for the details. the blogosphere is like owning your own personal research team. The world is mixed with Asia mainly green but Europe mainly red. Doctor Copper (with a PhD in finance) is rallying. All the signs are there for economic growth. Don’t be fooled.
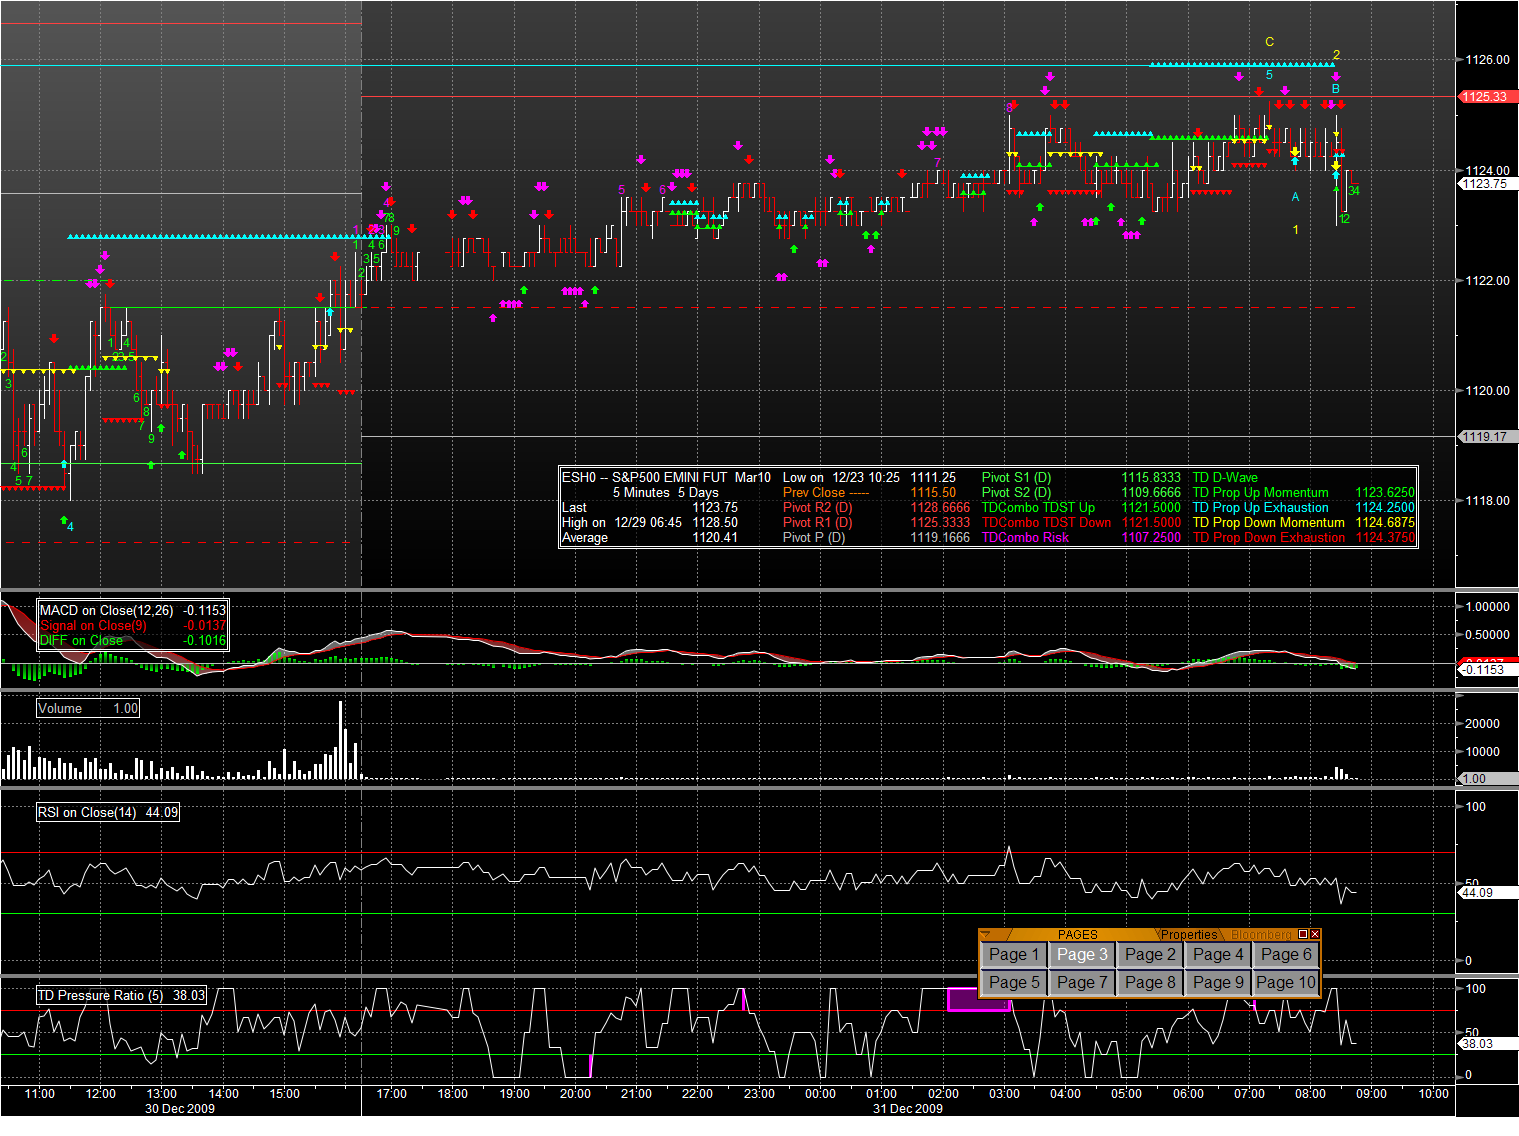
Right to the meat. ES continues its shallow rally off the bottom from yesterday. PIvots:
- R2: 1128.75 = Possible if anyone wants to play reindeer games.
- R1: 1125.50 = Seems to be overhead resistance at this time, but TD thinks that ES = 1126 is going to happen (the blue line and blue picket fence). Being overbought on a 5 min chart does not seem to matter. Current floor is virtual (no TA) and at around 1122.50. ES will remain range bound and likely get turned back up on any dip by the TD dashed red line at 1121.50. This is the line in the sand for going long with stop, or to indicate time to go short if there is any dip.
- Neutral: 1119 = in the middle of support going back a number of days. Volumes have been low, but this is where the buying seems to come in.
- S1: 1116 = Support from 24 Dec.
- S2: 1109.75 = Doesn’t seem to have any importance today. The low from yesterday was 1113. Note it well.
FX
USD is putting on a move down. INteresting given how TNX and the 10 year yield are ramping up 10 bps – which is a lot. Those FCBs who bought in auction are probably regretting it now as they are getting hit on the value of their Tbills but gaining a bit on the cost to buy USD to settle today.
CAD, EUR, and GBP are stronger. JPY is weaker. There’s a riddle for you as the risk trade is on but not in the USA.
Apparently, today is a normal trading day – so be careful of the reindeer games.
Here is a little mood music as we see the end of this bittersweet year. As the elites are saying: “We only meant well. It’s for the best.” As gmak says: “The road to hell is paved with good intentions.” Tick. Tock. Tick. Tock.


