


Living Inside a Broken Clock: Wednesday, Jan. 6, 2010
Living Inside a Broken Clock: Wednesday, Jan. 6, 2010
by gmak
Iceland balks at giving away the country and becoming debt slaves. Personal bankruptcies grow in the US as the FED promises a QE II. Treasury supply at the short end of the curve was 5 times oversubscribed as many are willing to swallow 0% in what is perceived as the safest haven. School districts are still waiting for that cheque in the mail from the municipalities and public service unions are being increasingly asked for wage concessions. When you can borrow for free and invest in any asset that everyone believes can only go up, you get the SPX. Welcome to the broken clock.
EQUITY
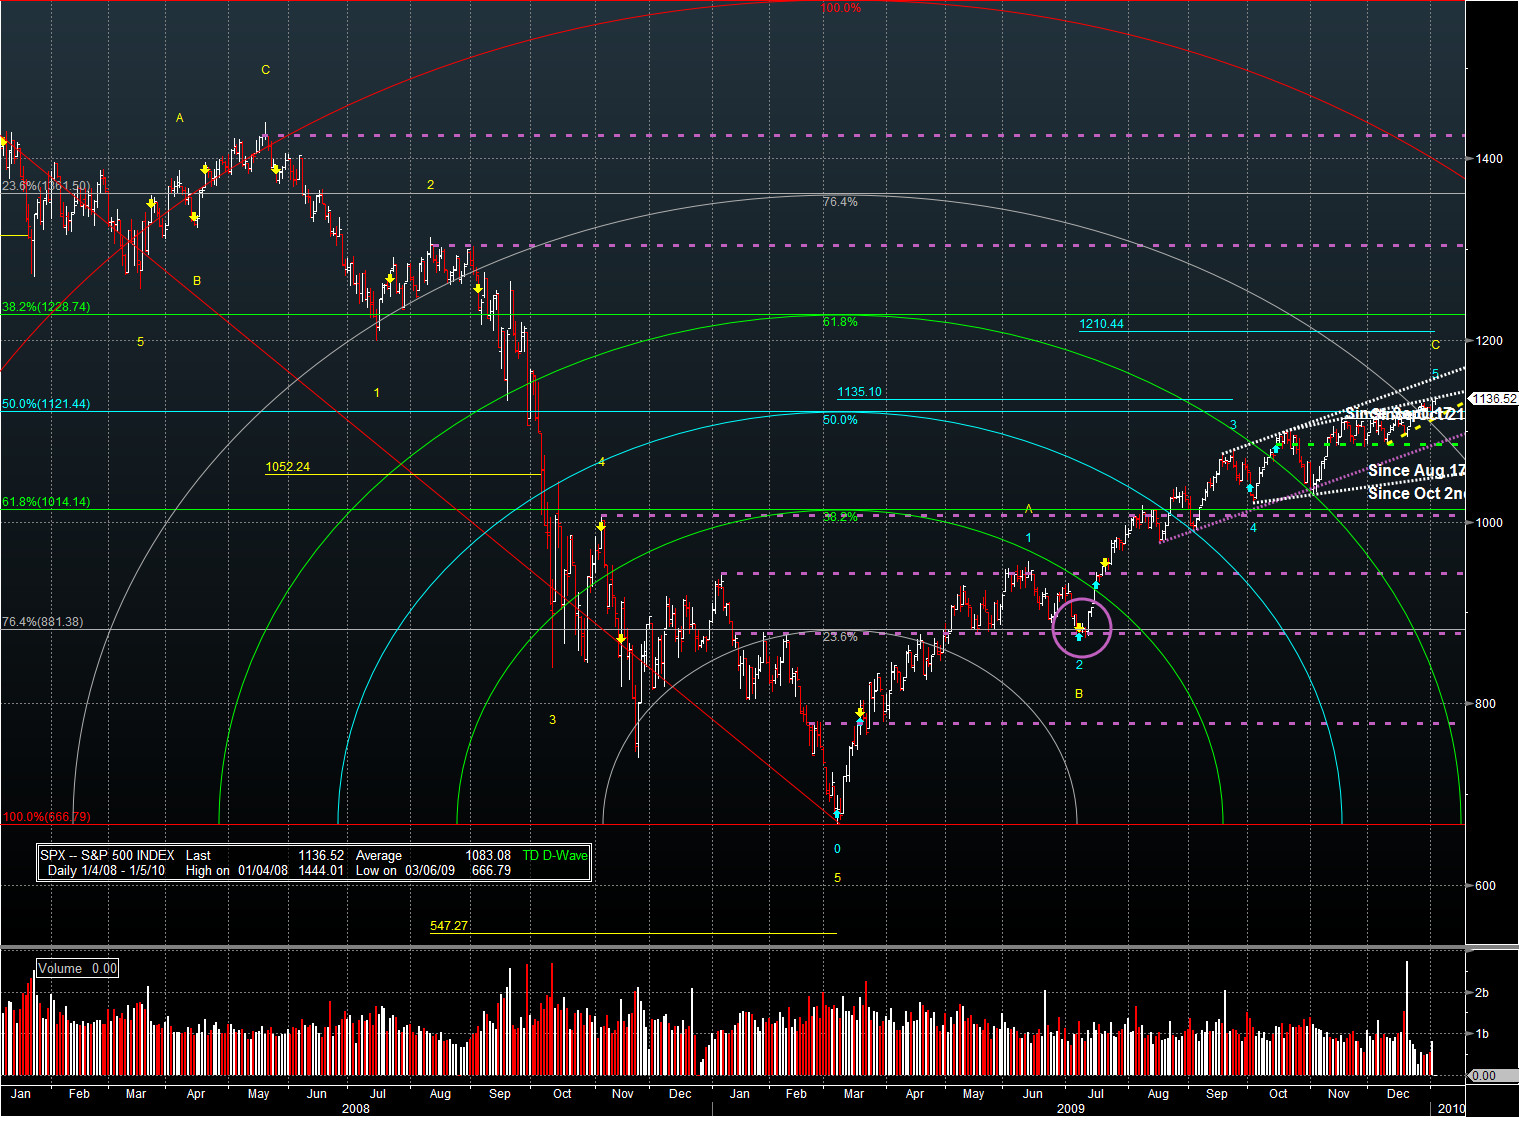
This chart is what I like to call my ‘ground zero’ for obvious reasons. The point that I want to make is that if you draw methodically-spaced arcs on any price chart, there will be a number of areas where price and arc appear to be dancing together. This is random – but it sure makes for a good story if you want one. I think the most important part of this chart are the FIB retracement lines.
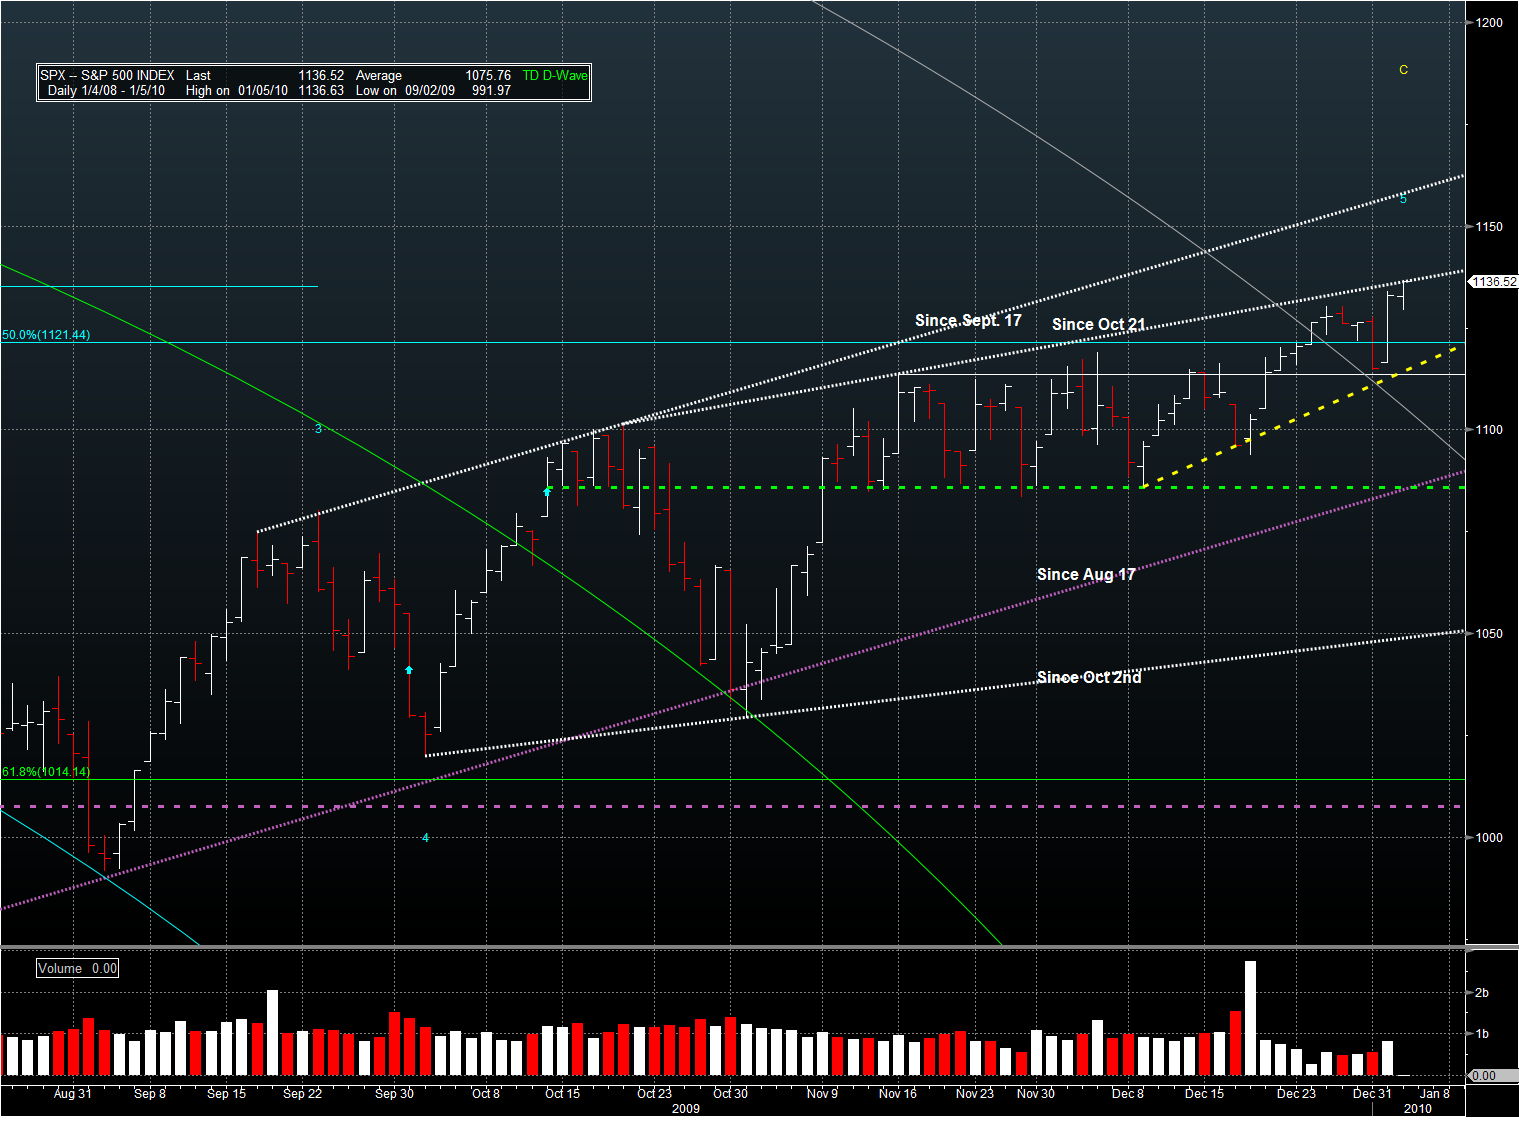
The next chart is a zoomed-in view. SPX is pushing hard against the upper trend line from Oct 21st. Buyers are aggressive here due to the news that the FED is going to do everything to have a QE II. WIthout a vocal populace, Congress will probably meekly go along -after all, it’s not their money, right? Writing this on Tues. night before lockup, I would say (at first blush) that this is a shorting opportunity – from the chart. However, the promised oceans of liquidity still to come, coupled with after-hours reindeer games in the futures, suggests that stops should be put quite tight.
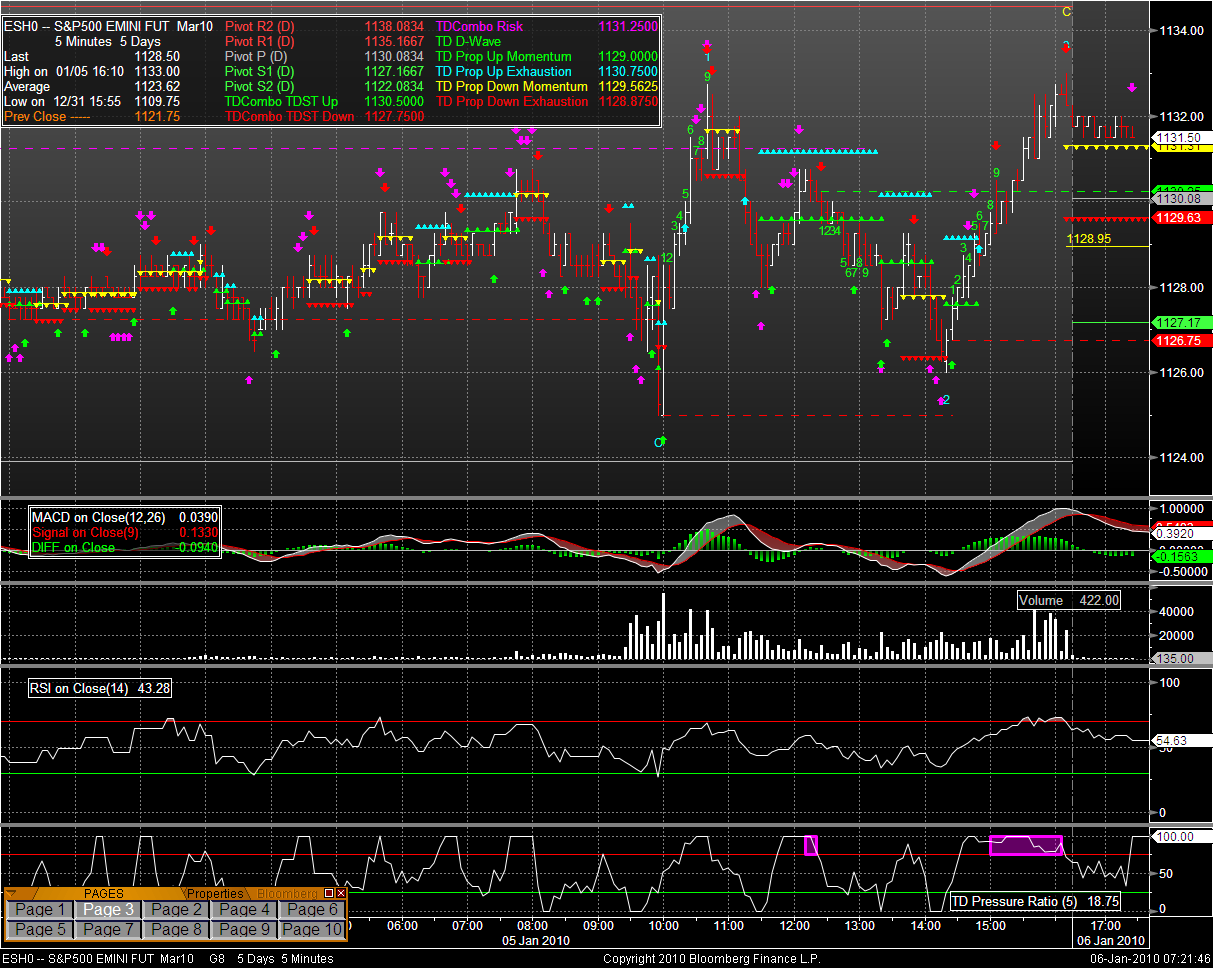
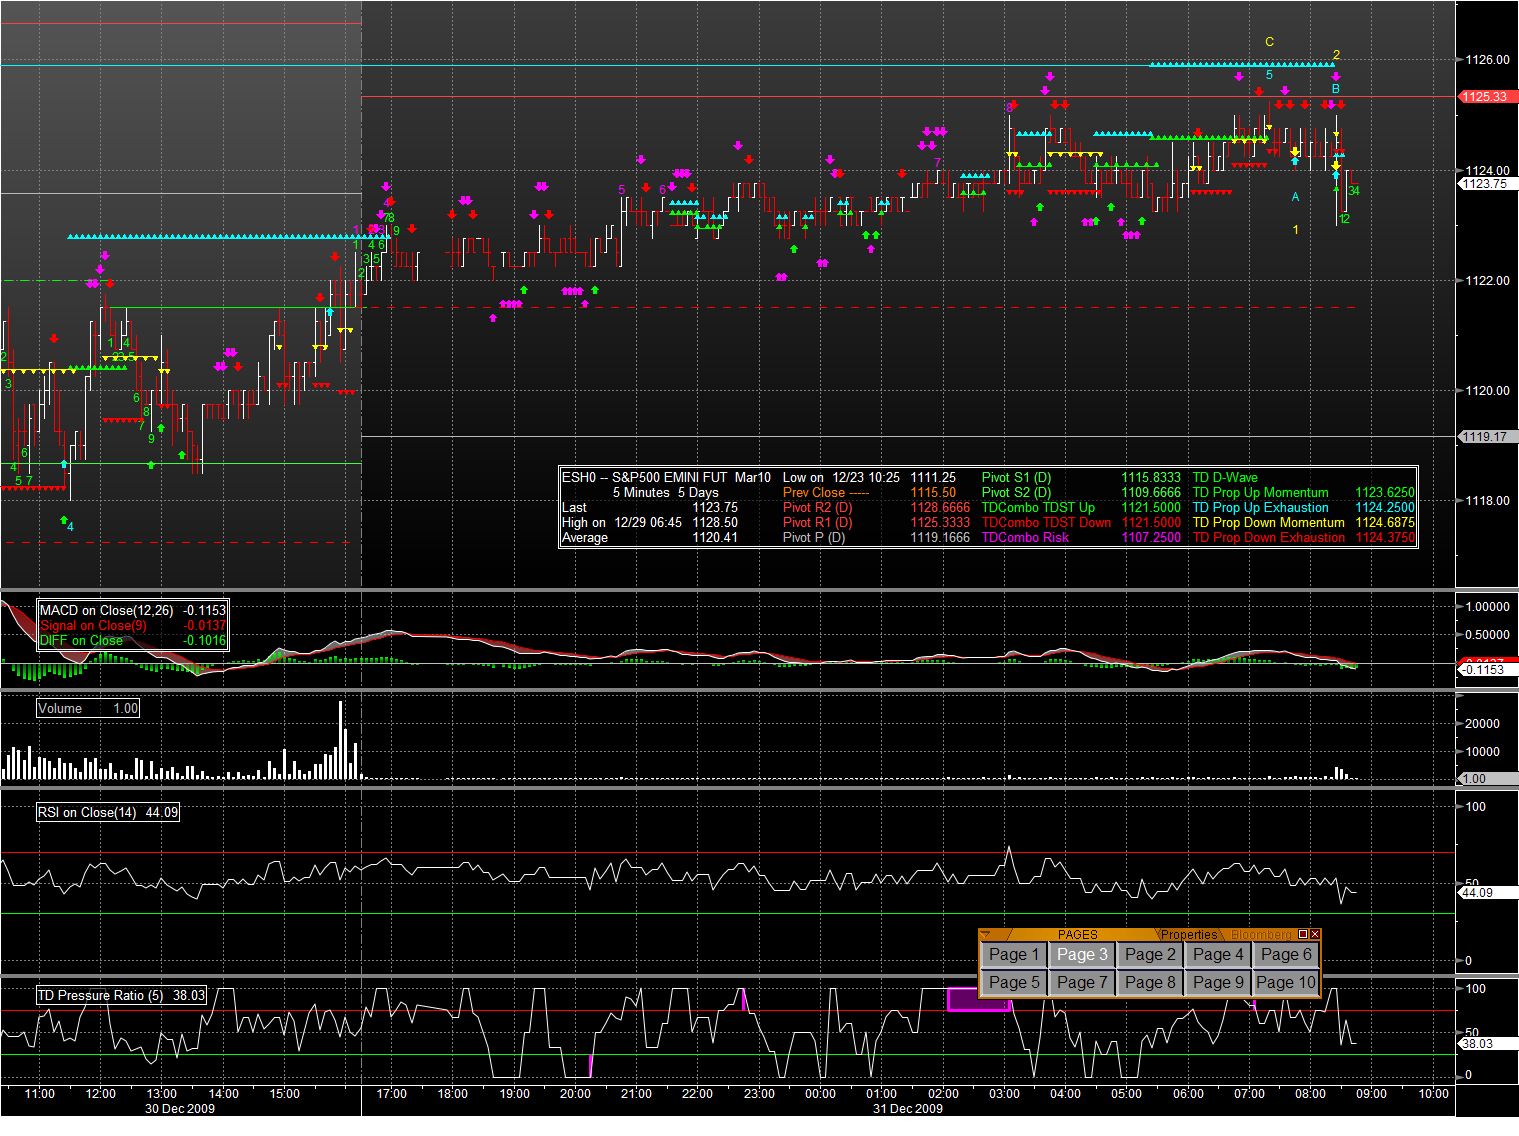
This is what I posted last night under Reindeer Games. The chart was garbage. Unfortunately, I had Bloomberg / file saving issues and the chart says Dec 31. The strange part is that the pivots are still good. I’ve taken the liberty of putting in the actual chart from that time frame.
As of this writing coming into lockup on Tuesday evening, ES is near what I call the neutral pivot. 1135 – 1136 looks like an interim area of resistance. Looks like Skynet is back with regular upward price movements starting at 2 PM. Using my predict the weather approach, and remembering what happened last night, go long at Europe open with appropriate stops. Sell after the first 1/2 – 1 hour. Come back in around 2PM to ride ES into the close. Obviously this shouldn’t be followed blindly, but with carefully picked entry points and stops. ES pivots:
- R2: 1138 = comfortably above the upper trend line on the daily ESH0 chart. Breaching this suggests irrational exhuberance above the irrational exhuberance. A short would be a very gutsy move without proper protection.
- R1: 1135.25 = This could be the upper barrier for overnight trading. It’s hard to say this early. But, it would be a point to look for a short entry depending on how the action is unfolding and how close it is to Europe open.
- Neutral: 1130 = Was resistance for the last 2 days. Probably has turned into support for a long scalp later on.
- S1: 1127.25 = More support from the bottom end of the range over the last 2 days. If this breaks then it will break hard. Good place for a stop on a long from the Neutral pivot. Good place to think about going short if it is breached.
- S2: 1122: I don’t see any recent support here. If broken, 1119 is the likely bounce level tonight.
But, all this is just opinion and speculation. Overnight is just too weird.
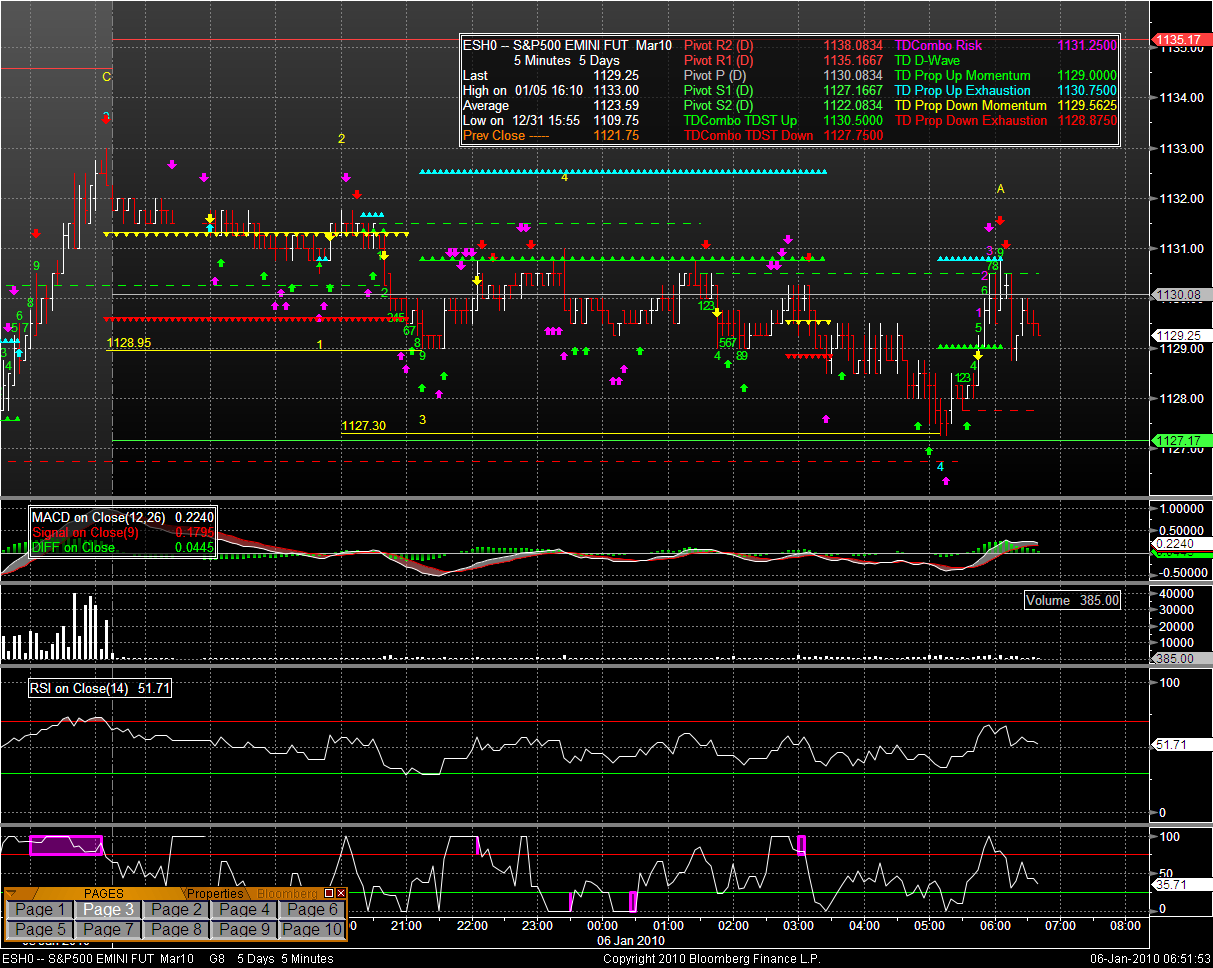
And here is what actually happened: ES driftd down until hitting the pivot at 1127ish. Right now, TD is showing that 1130.75 is solid overhead resistance, and that 1127 is support below. There was a lot of dancing around the pivot at 1130 until it broke downward gradually after the Europe open.
The pivots remain the same.
Asia and Europe are mixed. The DAX appears to be consolidating at the most recent top and there is better breadth in green than yesterday. Europe is still worried about USD weakness (well EUR strength if the truth be told). Industrial nw orders MoM were down more than expected. MoM producer prices were up less than expected.

FX
The USD is making a minor comeback with JPY much weaker. EUR and GBP as slightly weaker. CAD is slightly stronger. There are changes in the cabinet in Japan.
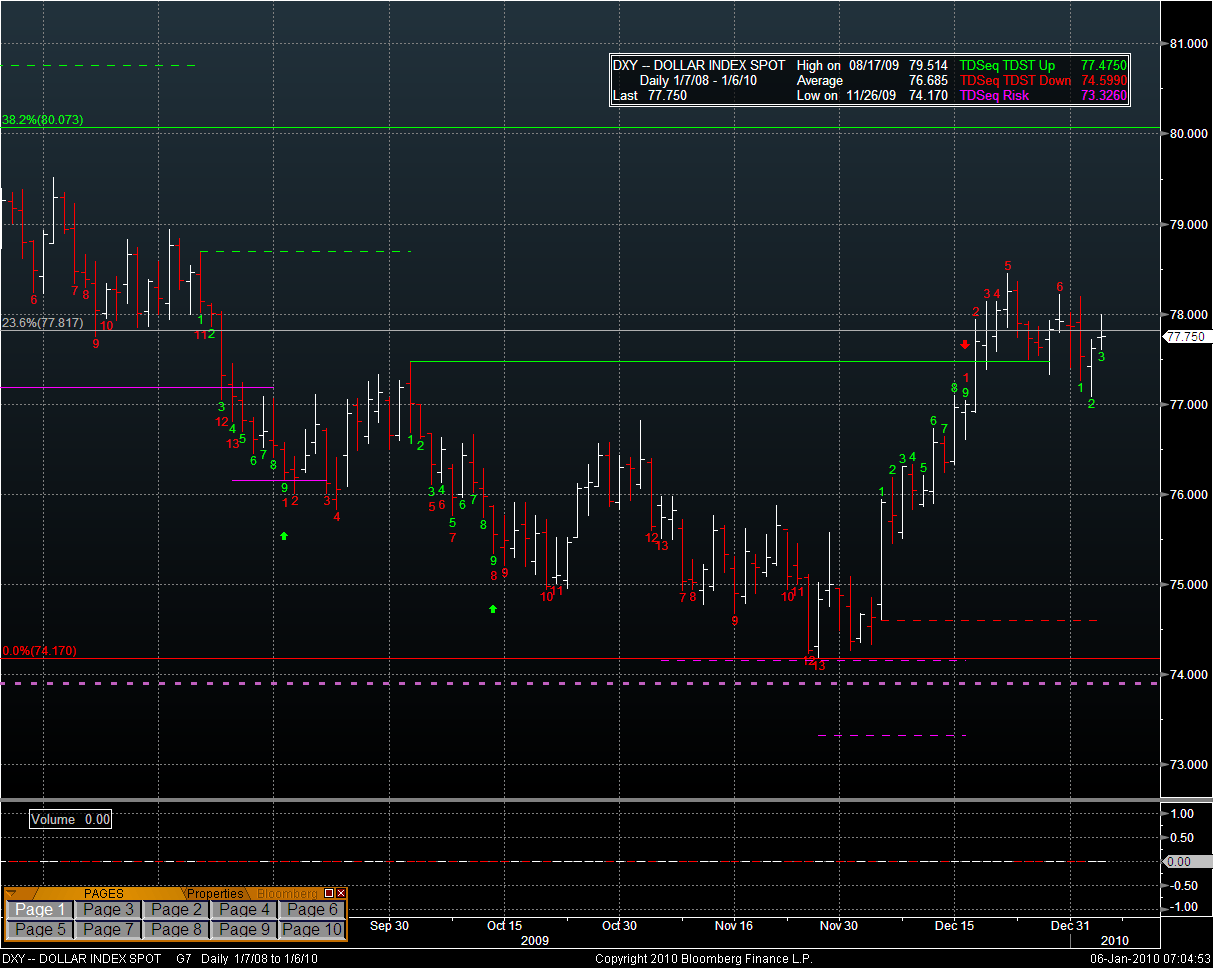
The USD via DXY is putting in lower lows and lower highs. This could be consolidation before another move higher. If it is, TD Wave says that Wave 3 up has started. If not, Wave 4 down is being put in – on a 30 min chart.
On the daily chart, DXY is having trouble getting up through the 23.6% FIB at 77.817. Definitively looks like a downward channel forming.
NEWS
DATA
MBA mortgage applications were 0.5 vs 0.1% expected and -22.8 revised prior. The minutes of the FOMC meeting come out today and you can be sure that the language COULD be a market mover. It looks like SPX (extrapolating ES overnight action) is being rejected at the trend line “Since Oct 21”. ES is range bound, so far, and there are good trades with going long near 1127 at the pivot and the stop below that. Short ES oks good at 1130 and above with a stop above 1131. The targets are the two pivots at 1130 for the long, and 1127 for the short – for the time being.
Cheers.


