


Massive Late Summer 2018 MOMO Update
Massive Late Summer 2018 MOMO Update
Alright, you better grab yourself a tall cup o’ java or tea as this is going to be the most massive momo update of this year. And a rather tumultuous one it has been thus far, as it was literally plastered with nasty bear and bull traps. I personally think I’ve done a reasonable job of steering you guys through it, and aim to now bestow you with sufficient technical context to allow you all to greatly prosper in the final, most bullish, season of the year.
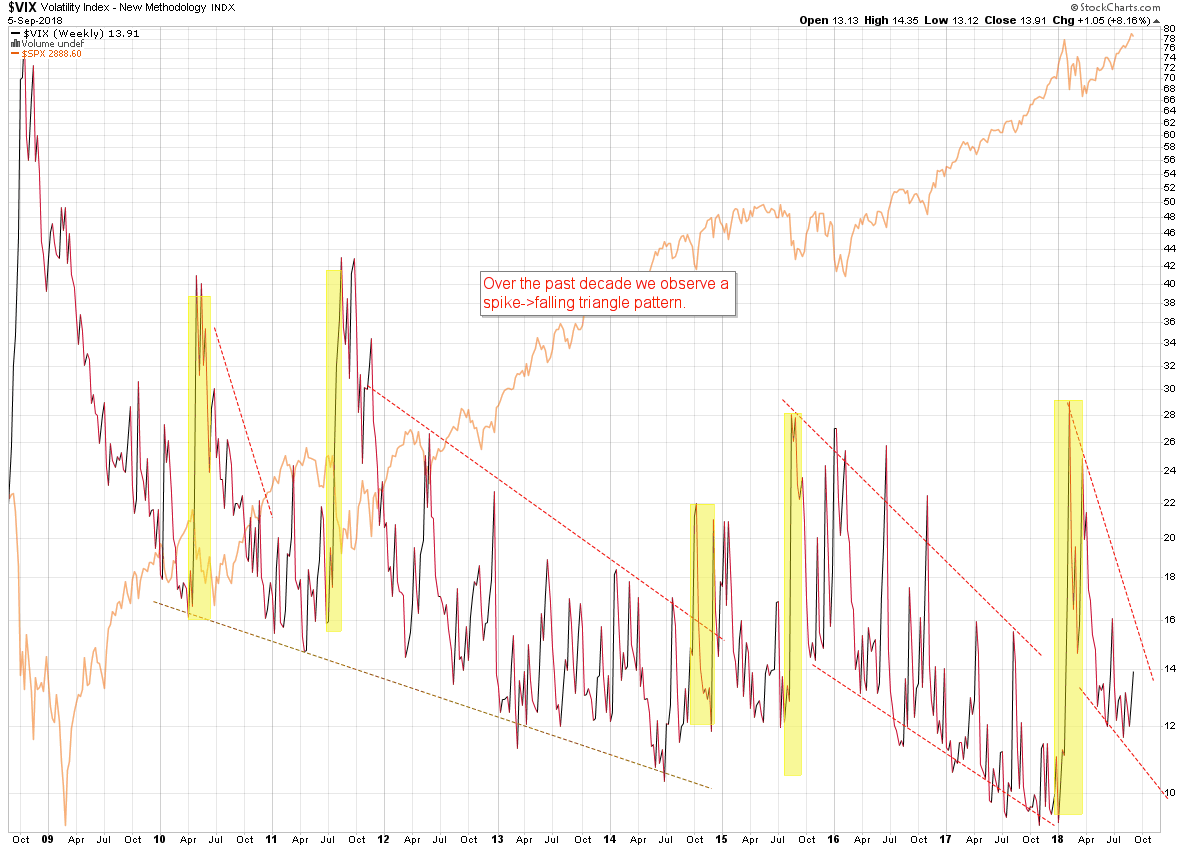
Let’s start with a new addition to our collection of momo charts: a long term perspective on the VIX which shows us an intriguing pattern of IV spikes followed by a falling triangle pattern. The extent of the triangle compressions over the past decade or so has been unpredictable.
But what we can clearly glean from this chart is the fact that IV seems to be compressing like a coil over long periods after large outliers, i.e. moves far exceeding the 2.0 standard deviation. So where are we right now?
From what I can gather we are in a quickly compressing range which suggests that a wave of fear triggered in early 2018 is quickly dissipating. But quite frankly it’s a bit early to say as we have not seen any decent medium outliers over the past year.
Now hold on a second. By any definition this has been a rough year for equity traders. I’m not just talking about long term realized volatility (RV) which clearly jumped causing trigger waves throughout the first half of the year. Why would implied volatility (IV) then revert back to lower levels in the 2nd half?
This is not a question I can answer to be honest and my sole explanation is that perhaps that rapidly improving economic conditions are having a strong impact on risk perception in equities.
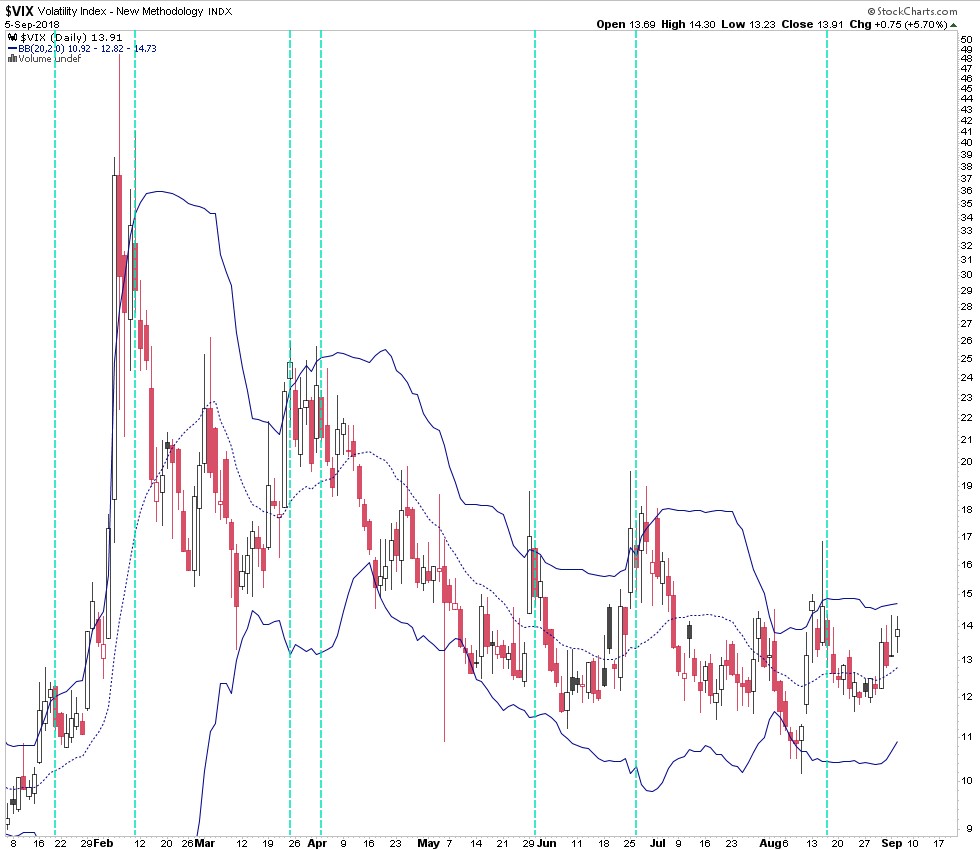
The vanilla VIX chart shows us the series of VIX Buy Signals and pseudo signals (i.e. the ones which didn’t satisfy all three pre-conditions). As this one is more short term you can also observe how the range continues to compress after the large outlier in February which triggered/reset the new falling triangle pattern.
In your mind you can superimpose this BB on the long term VIX chart above and in combination those two charts make for some very profitable bottom (and to some extent top) fishing.
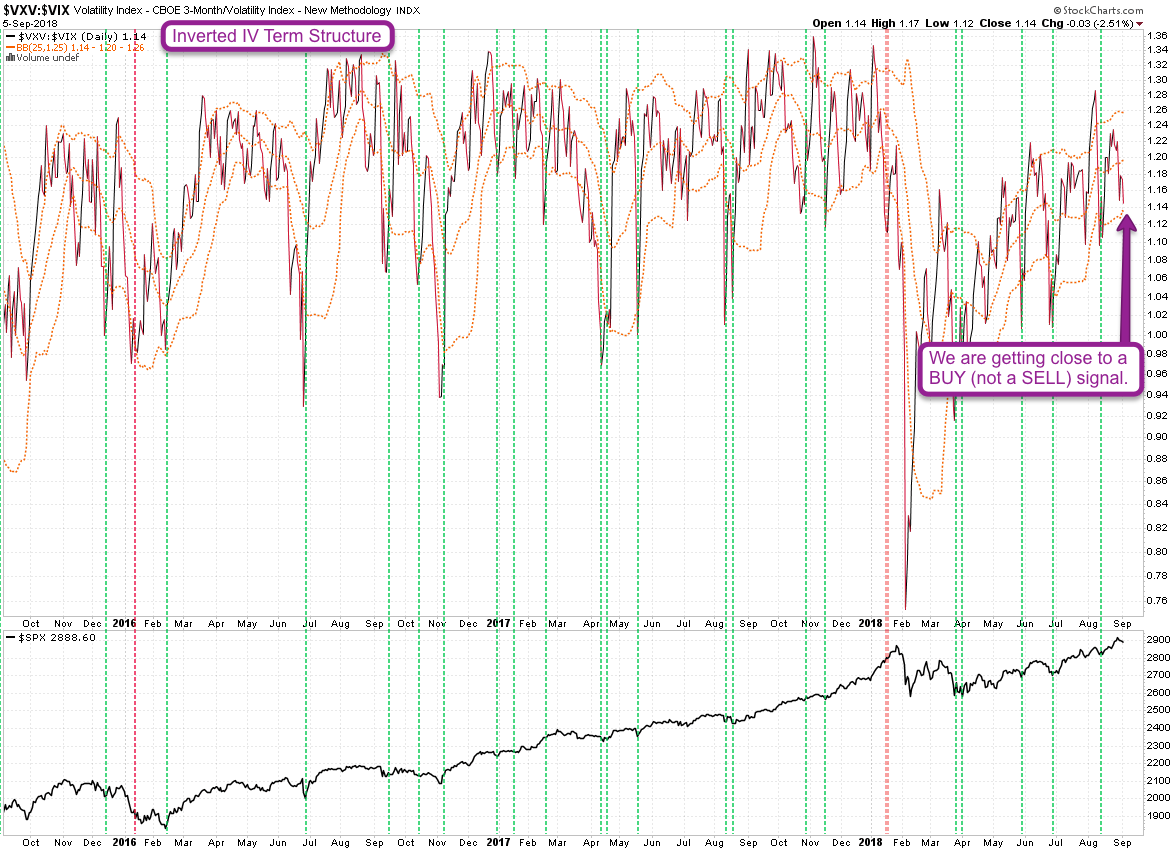
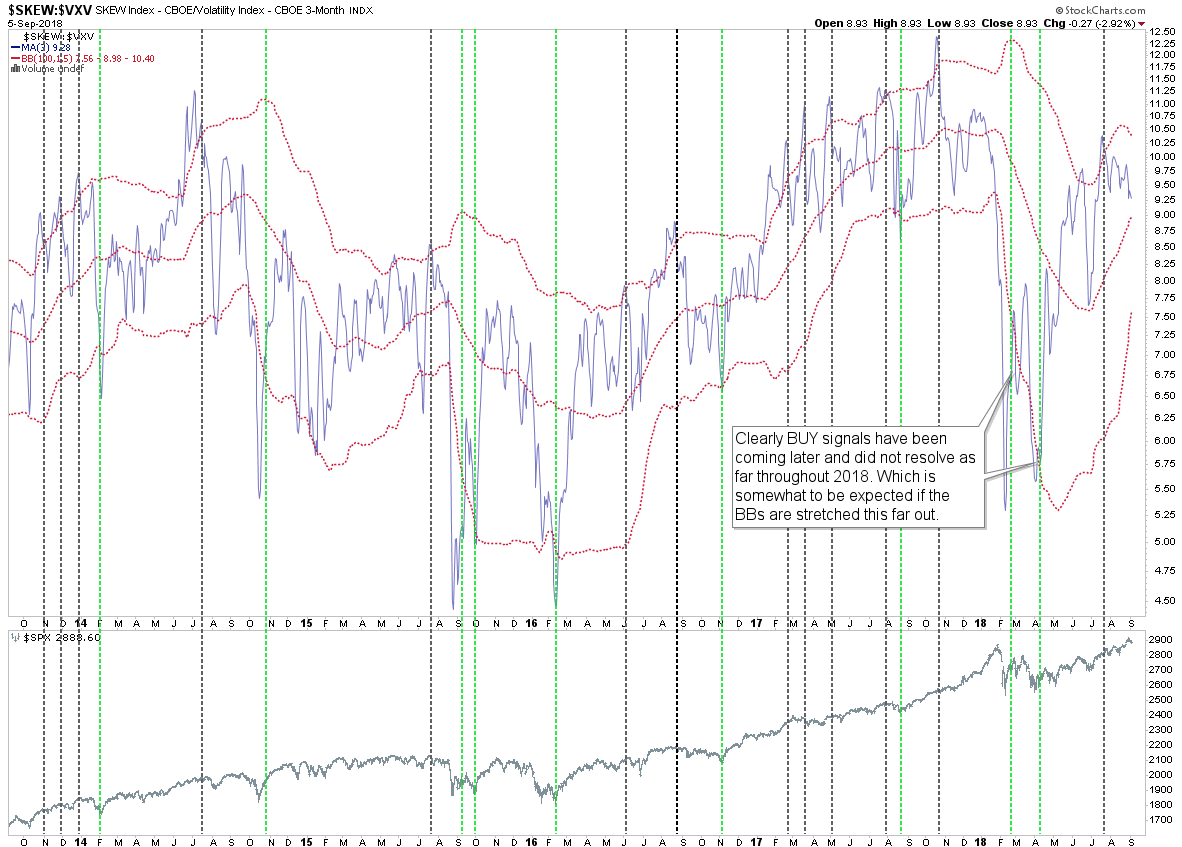
Here’s a view at the inverted VIX:VXV ratio, a.k.a. the Implied Volatility Term Structure (IVTS). This is actually one of the most bullish long term momo charts in my arsenal at the current time. We got a textbook buy signal in August and until we drop through the lower BB again we seem to conclude what looks to me like a late summer correction.
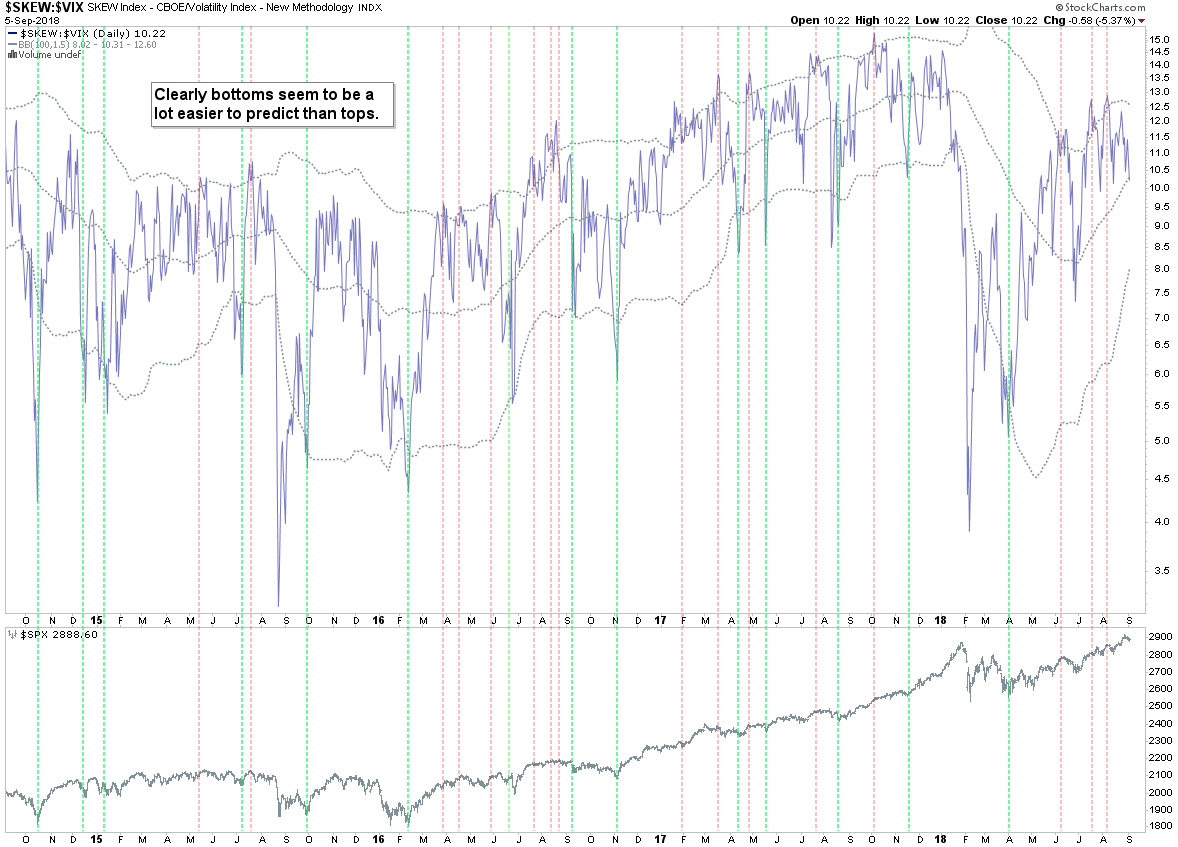
Over the past few years the SKEW:VIX ratio has been our go-to chart for catching long reversals. As mentioned on the chart bottoms seem to be easier to predict than tops. Which however seems to be changing slowly from what I can gather.
The current reading has us in a correction similar to what we saw on the IVTS chart and it should be noted that we are quite far away from anything resembling a buy signal. That does not mean we are destined to correct lower of course but if the bears can stage a take down then IV conditions would be amenable.
SKEW:VXV is a more long term perspective obviously but equally fascinating. IMO it’s doing a better job at signaling short reversals, the problem is that the magnitude of corrections can never be predicted. Which again should be expected in a bull market.
The last short signal was issued in late July and as you can see it was good for a series of small corrections. That’s a pattern we have observed several times in the pst few years, once again showing us the vehemence of the ongoing bull market.
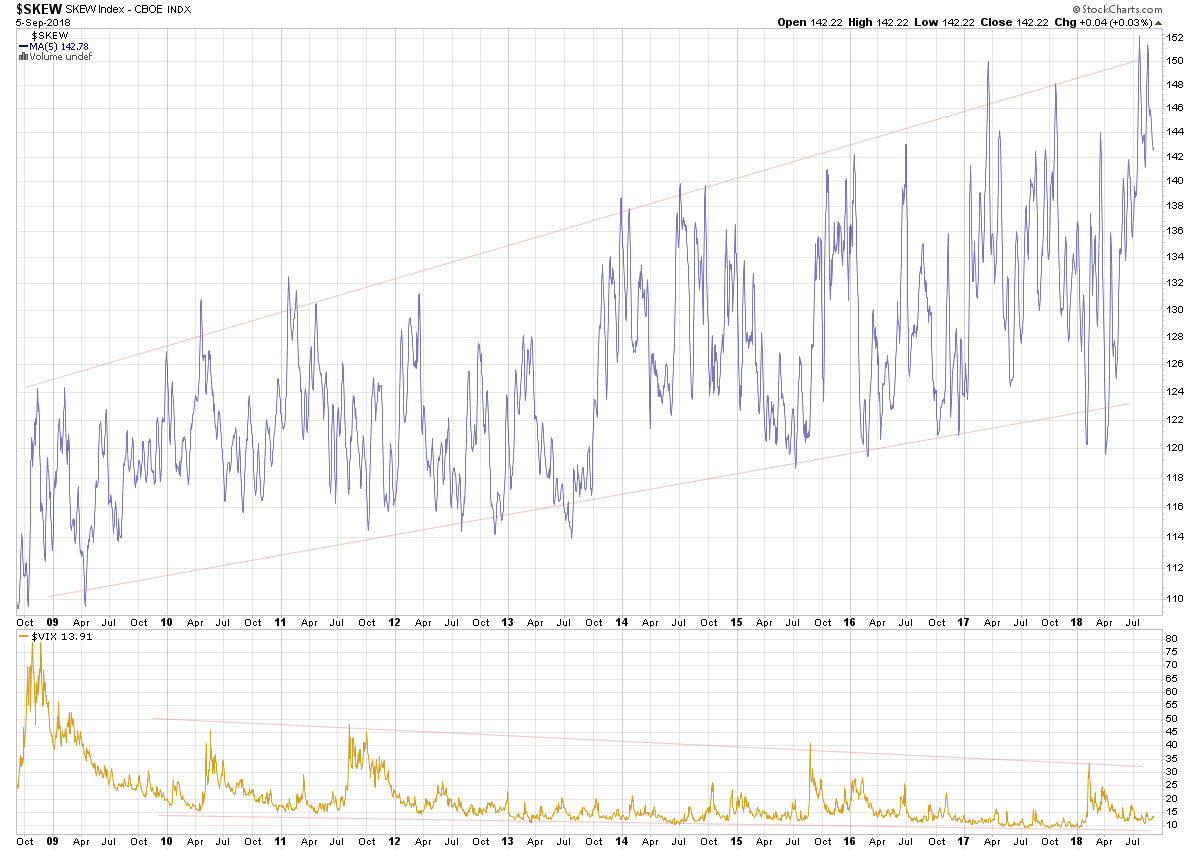
Let’s wrap up the IV charts with the long term view on the vanilla SKEW which also seems to follow a well established trend. But in this case it’s a rising one. If you contrast this chart with the falling channel on the long term VIX in the panel below then that’s a rather compelling perspective, wouldn’t you say?
Namely whereas the VIX range continues to contract the range channel of the SKEW continues to rise. I’ve said for a long time that the SKEW on its own is pretty useless, but I don’t really think that’s the CBOE’s fault.
It seems to me that investor sentiment is somewhat affected by cognitive dissonance in that short term bullish perception is not fully supported by that of medium to long term catastrophic failure, i.e. the anticipation of six sigma events.
In other words the longer bullish conditions prevail the more market participants appear to fear the potential of completely unpredictable events. Maybe I shouldn’t call it cognitive dissonance but just outright wrong as six sigma events can happen at any time in any market condition. But at any rate the SKEW tells us more about the perception of market participants than that of actual tail risk.
Well, we just barely scraped the surface as we have 14 more charts to go. If you’re not a subscriber then this is probably a good reason to remedy that unfortunate situation by joining up!

It's not too late - learn how to consistently trade without worrying about the news, the clickbait, the daily drama and misinformation. If you are interested in becoming a subscriber then don't waste time and sign up here. The Zero indicator service also offers access to all Gold posts, so you actually get double the bang for your buck.
Please login or subscribe here to see the remainder of this post.


