


Mulligan?
Mulligan?
This post is going to focus mostly on equities as there isn’t too much else to report right now. The E-Mini lottery ticket I took out last Friday proceeded to ISL rather swiftly, but we may be offered a Mulligan at what I consider a medium term inflection point. Let me set the stage for you guys…
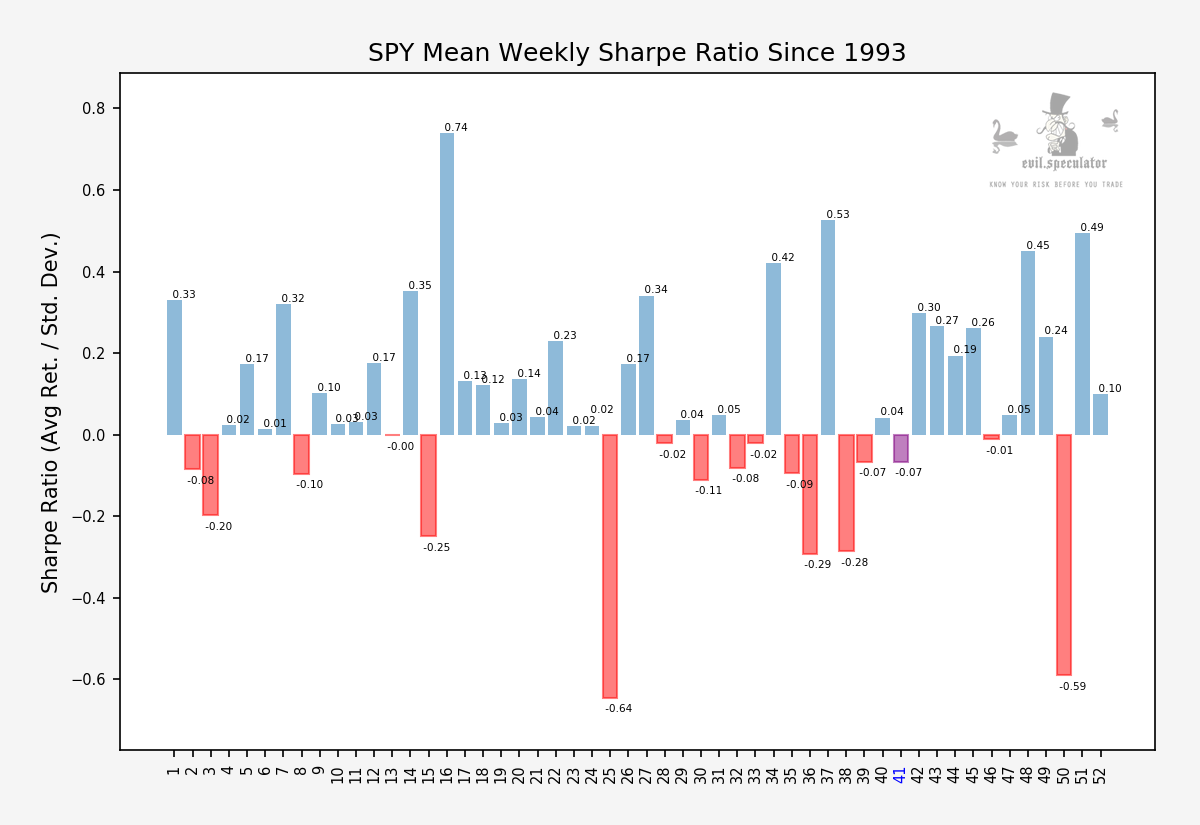
Historically speaking week #41 represents one of the three final bearish ones of the year. Starting with earnings season we are looking at nine sweet up weeks interrupted only twice by a minor and finally by a massive down week. We’ll deal with that one when we get there but for now we are looking at a traditionally bullish season.
Shameless Plug
If you’re a statistics aficionado like me then sign up here for a FREE 2-week trail of our Evil Speculator Statistics Tool, instantly giving you access to comprehensive weekly and monthly statistics on thousands of stock symbols on the S&P 500, the Nasdaq, the Russell 2000, the Dow Jones Industrial Index, and more. To see a FREE sample of all available SPY statistics please point your browser here.
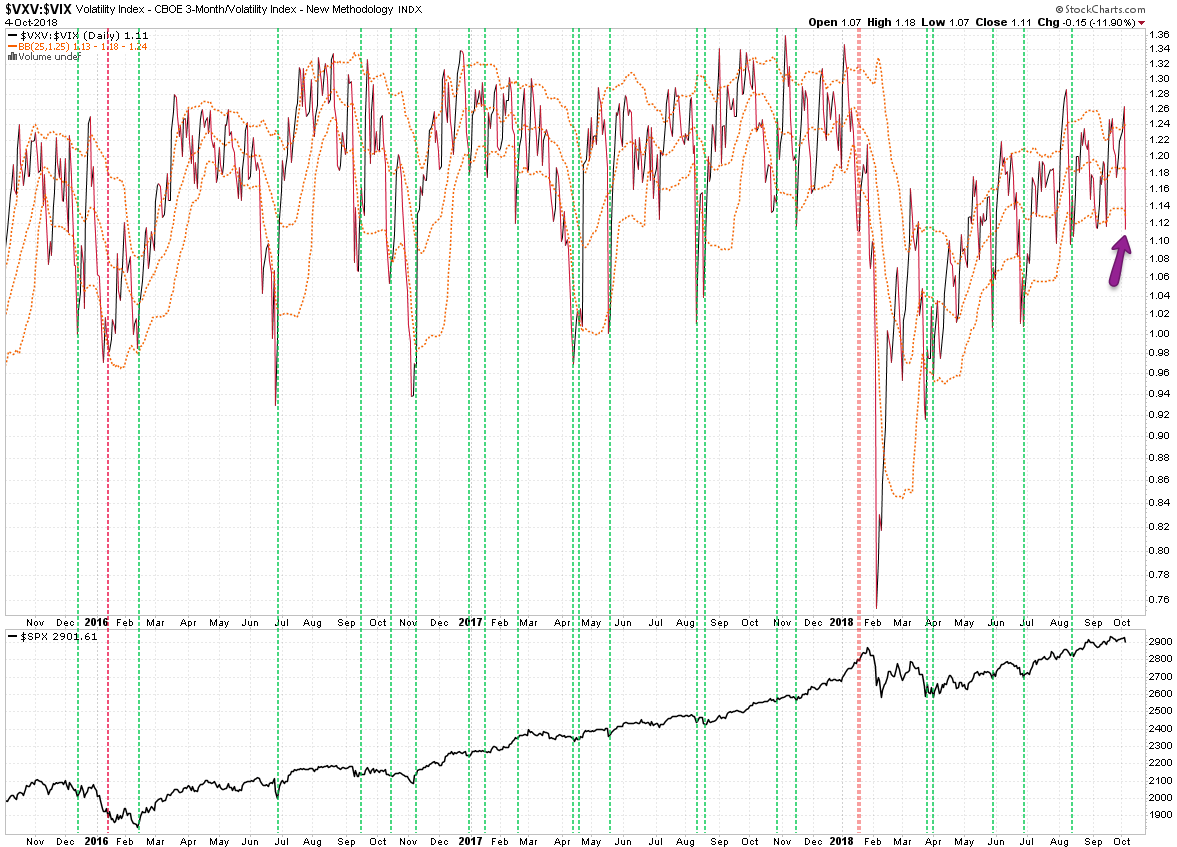
Now if you paid attention to my momo update last week (sub section – feel free to sign up now) then you know that this stands a bit in conflict to what we are seeing on the IVTS (posted above), which suggests that we may be looking at a medium term correction here.
And in terms of timing this week is really where it’s at, so in terms of entry opportunities in equities the situation is becoming a bit dicy.
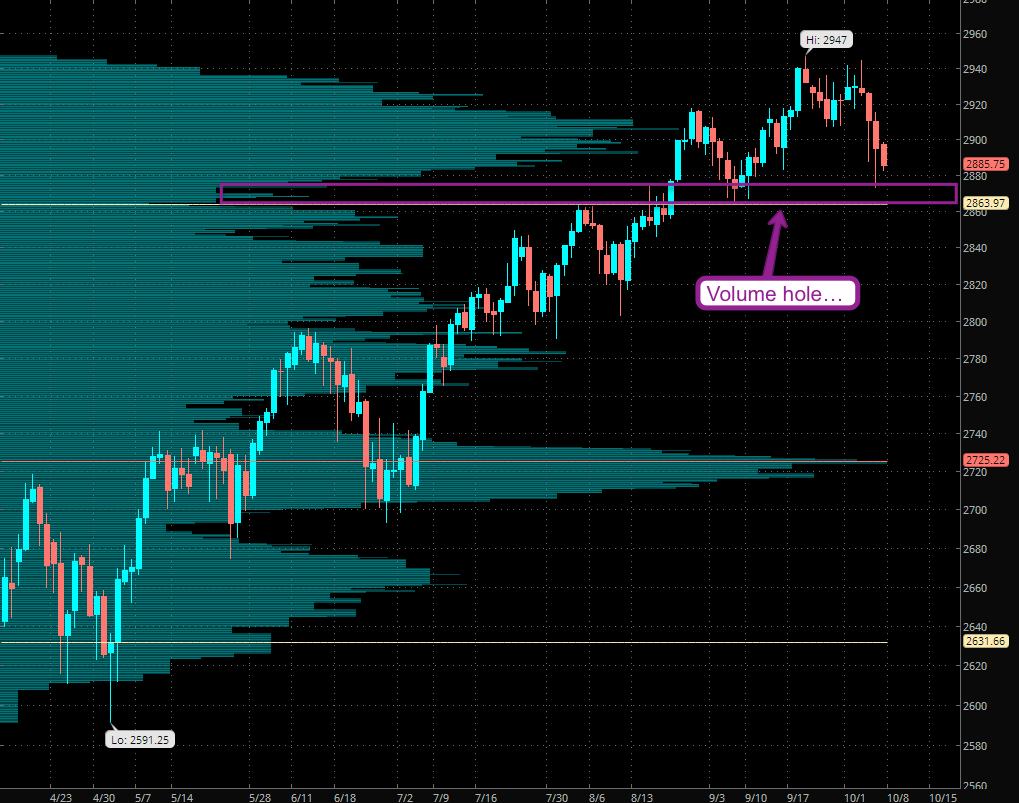
So let’s see what price has to tell us. If you look at the daily chart above then you probably see what I see – a sequence of higher highs and higher lows. The current drop puts us not only right above two small volume holes but also fits the current spike low series in terms of magnitude.
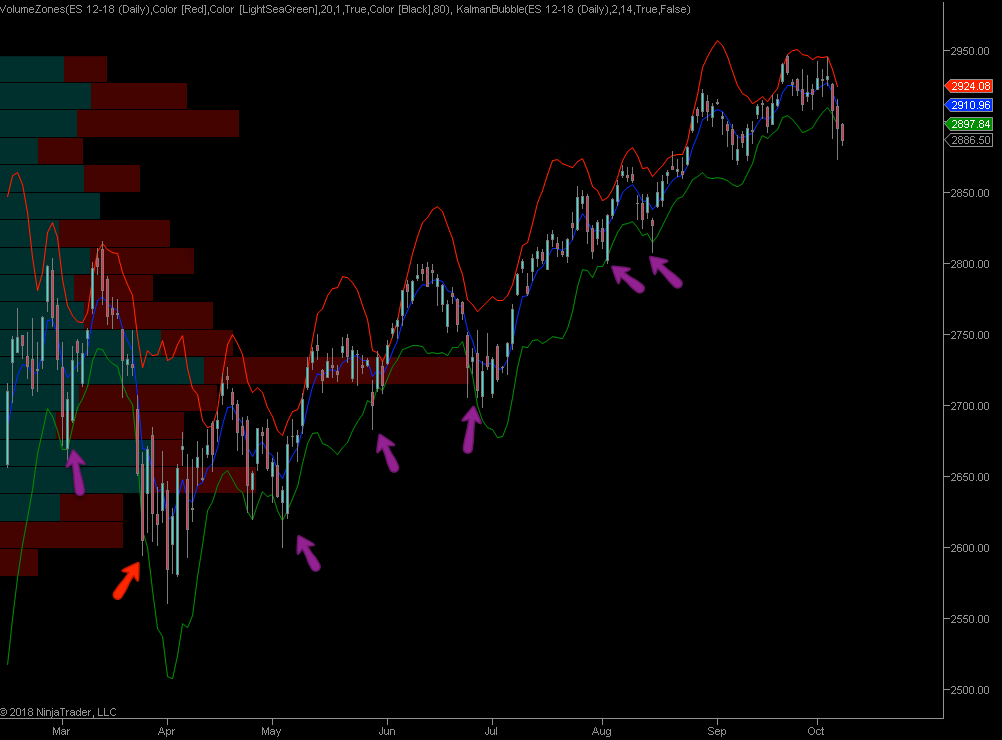
If you’ve ever heard of the Kalman filter used in modern signal processing then you may be surprised to see me use it on a chart similar to a Bollinger Band. I simply used the Kalman gain to bias between the measured signal (the price series) and what it would predict based on the historic data.
Be this as it may I think it’s doing a pretty bang job of predicting turning points. Evidenced by the red arrow it’s clear that, just like with any other lagging indicator, price sometimes keeps running, thus invalidating any reversal signals. When that happens the danger of a much larger correction however becomes more clear.
It’s kind of like with the problem the Kalman filter attempts to solve actually which is why I began to look into it. Let’s say you’re remotely flying a missile and the reported altitude continues to be way off what you would expect from the predicted trajectory. The Kalman Filter will attempt to give the reported data more validity as you obviously cannot argue with reality. It’s a fascinating topic and I strongly recommend you look up a few introductions online.
Anyway we seem to be in the process of completing another swing lower OR much more bearishness is in store for us, thus increasing the odds for a medium term correction the momo charts are suggesting.
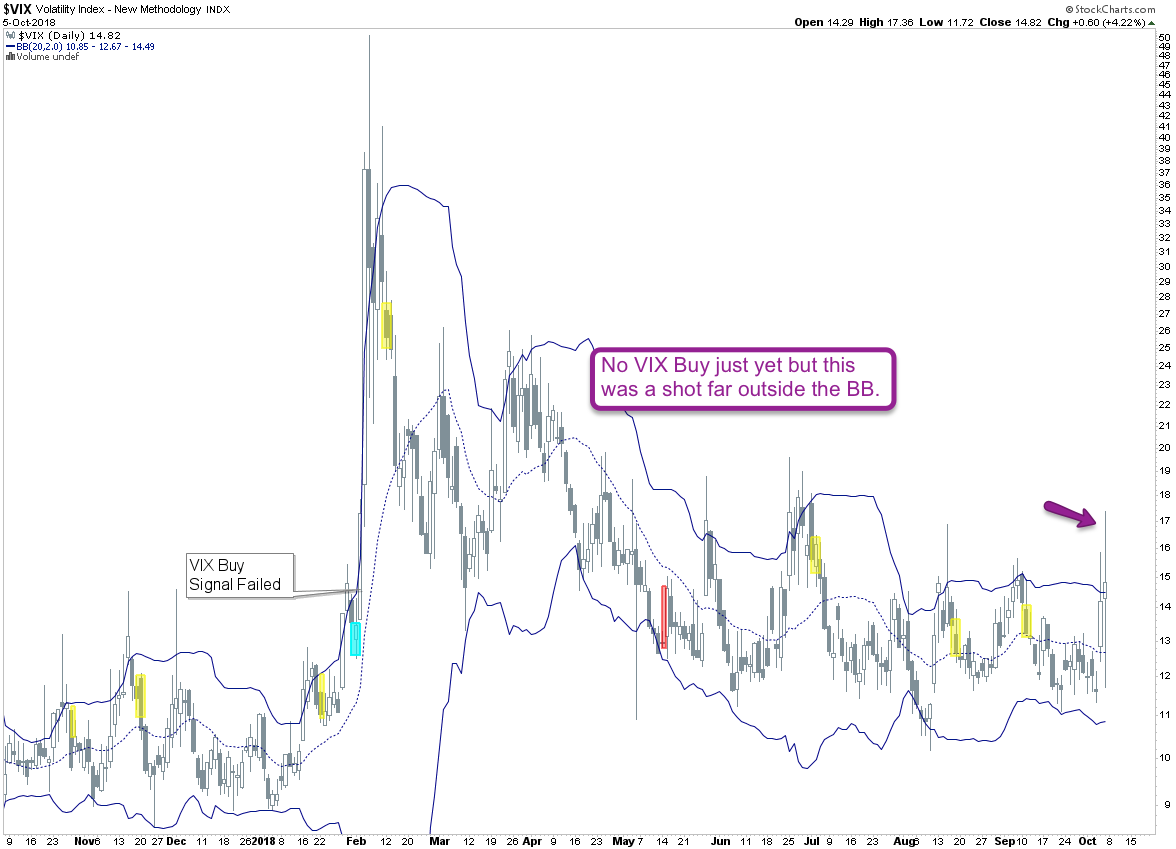
To just confuse you guys a little further – here’s the VIX which has NOT completed a Buy Signal just yet. In fact it’s poked its nose out of the BB twice and what we need is a lower close inside followed by an even lower close. But it’s quite possible that we see an even higher spike, which doesn’t happen often but when it does usually more bearishness ensues.
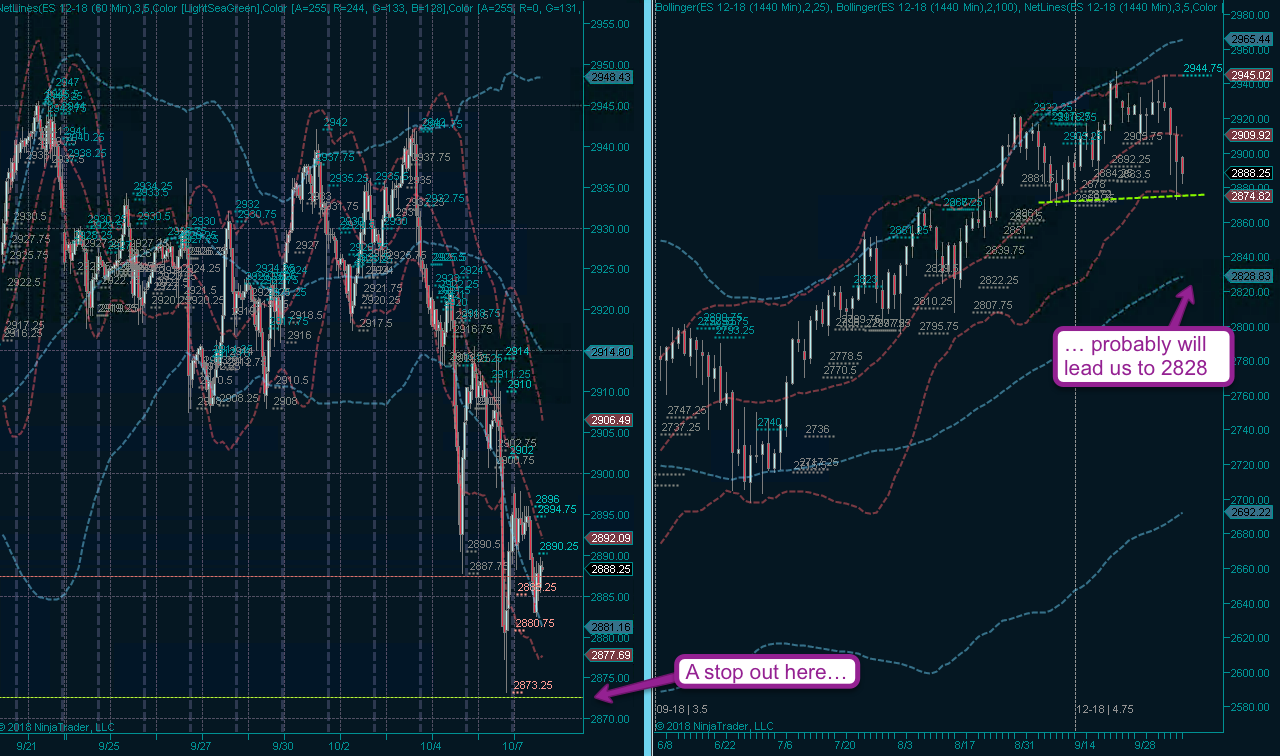
Given all the mixed data above I decided to take out another 0.3% long entry with a stop < the current spike low. My thinking is that if that one gives we are heading into something more massive and will have to regroup. The odds of that happen are 50/50 from what it seems, so this is another lottery ticket.
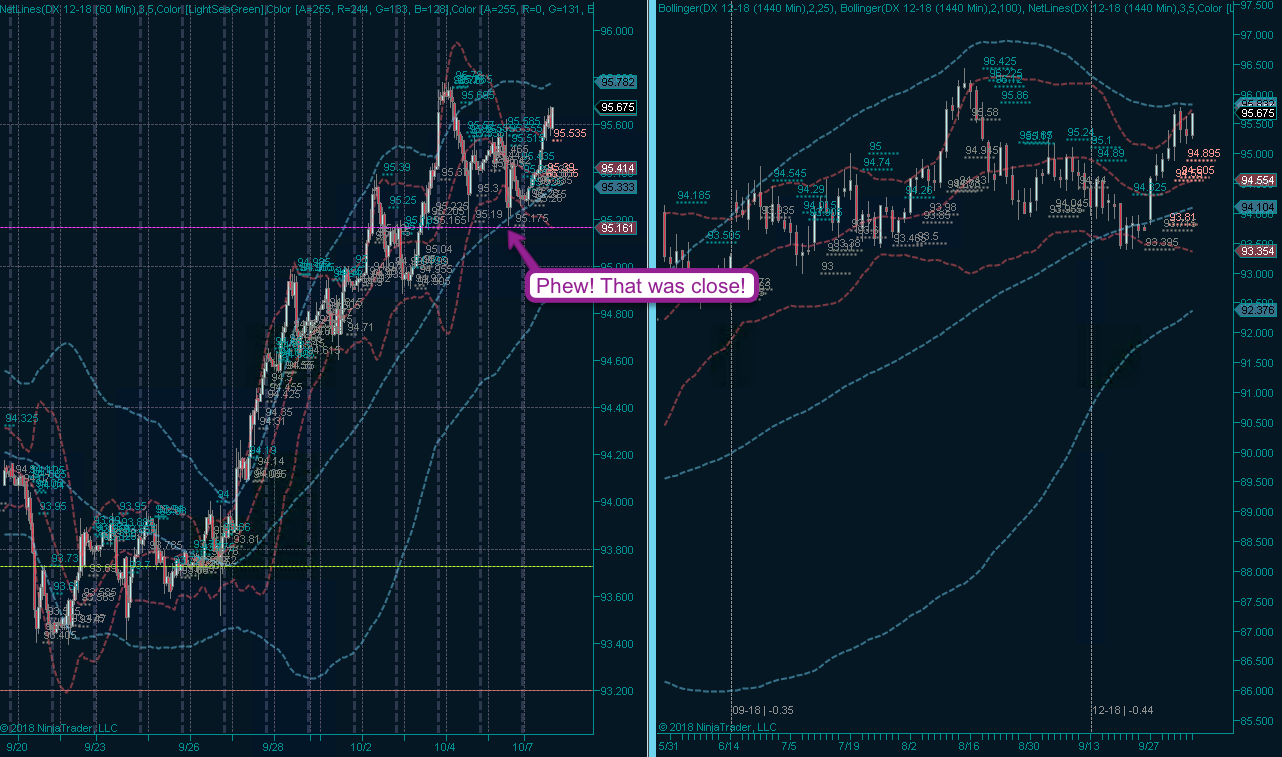
I got very lucky on the Dollar front as my stop almost got snagged. But it seems to be back on track now and may just muster up enough mojo to push itself above that upper BB on the daily panel. Keeping my fingers crossed 😉


