


Pivots Trading
Pivots Trading

Fujisan here.
It’s been so much fun visiting Vegas once again — too bad that I have to fly back to Seattle tomorrow morning.
Before I head out for a dinner tonight, I am going to make one quick post that I would like to share with you – that is how to use the pivots to your advantages.
Depending upon your trading time frame, the pivots could be used in a monthly, weekly, and daily set up, and let me give you a very good example of monthly setup with my GBP/JPY trades.
GBP/JPY Trade
Before I was taking off for Japan, I saw GBP/JPY was hitting right around the monthly R1 pivot points. I then built my position right around a doji that I saw on Aug 8th 4 hour time frame. High of the doji was 163.06, and low was 162.44, and I set up my entry point one pip below the low of doji (163.43) and a stop one pip above the high of doji (163.07) risking 64 pips. I didn’t know if it would make it all the way down to S1 level, but I know it would go at least down to PP level (pink pivots points), which was about 800 pips away, so my reward would be 800 pips, which would make a pretty good risk/reward ratio.
Doji high 163.06
Doji low 162.44
Entry Point 162.43
Stop Loss 163.07
Risk 64 pips
Reward 800 pips
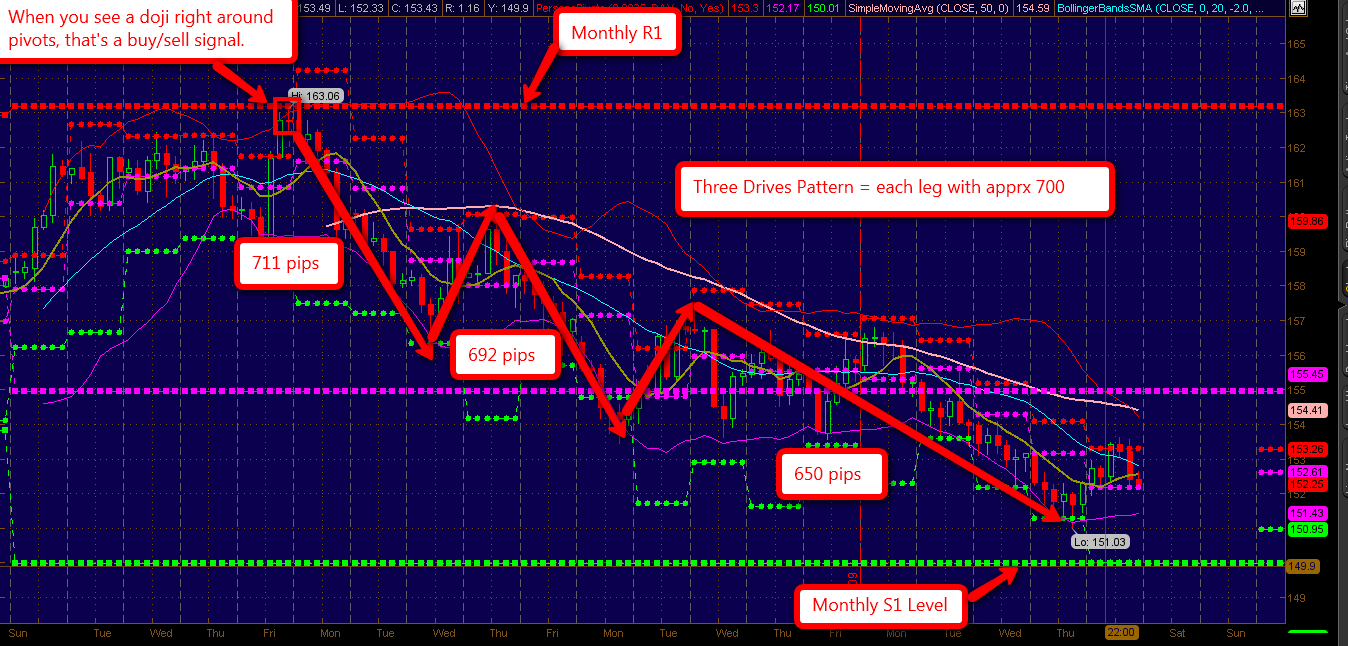
Now, because I had such a poor internet connection in Japan (yes, my hometown is surrounded by the rice fields and you can catch wild prawns in a little creek), I just let it run and moved my stops occasionally, and as a result, I was able to make more than 1000 pips in a matter of a couple of weeks! (In a retrospect, I would have closed my positions much earlier if I was managing it actively).
Now, my point here is that, I was able to pick almost the exact high of the month and exit very close to the low of the month all because of the pivot points.
Currently, GBP/JPY is getting very close to monthly S1 level, so I would be looking for another doji to go long if showing up around monthly S1 level.
You can use daily, weekly, and monthly setup, and I use 15 minutes charts for daily, hourly charts for weekly, and 4 hours for monthly. If you combine pivots with your favorite momentum indicators (such as stoch, RSI, MACD – it’s your pick), this will become even more powerful.
Trading the Futures with the Pivots
The pivots will work not only for currency trades, but works quite well with the futures. (Although I would have to say that the currencies are 75% technical driven, so TA works much better on the currencies than the futures).
I see so many people are frustrated with picking the direction. As I pointed out in my posting yesterday and today, we will be in this trading range for another week or so, and if you don’t know how to pick the direction, you may be better off sitting in the sideline until you know where we are going.
If you still like to trade, the market will give us a great opportunity to make money in both directions, if you know how to pick the direction.
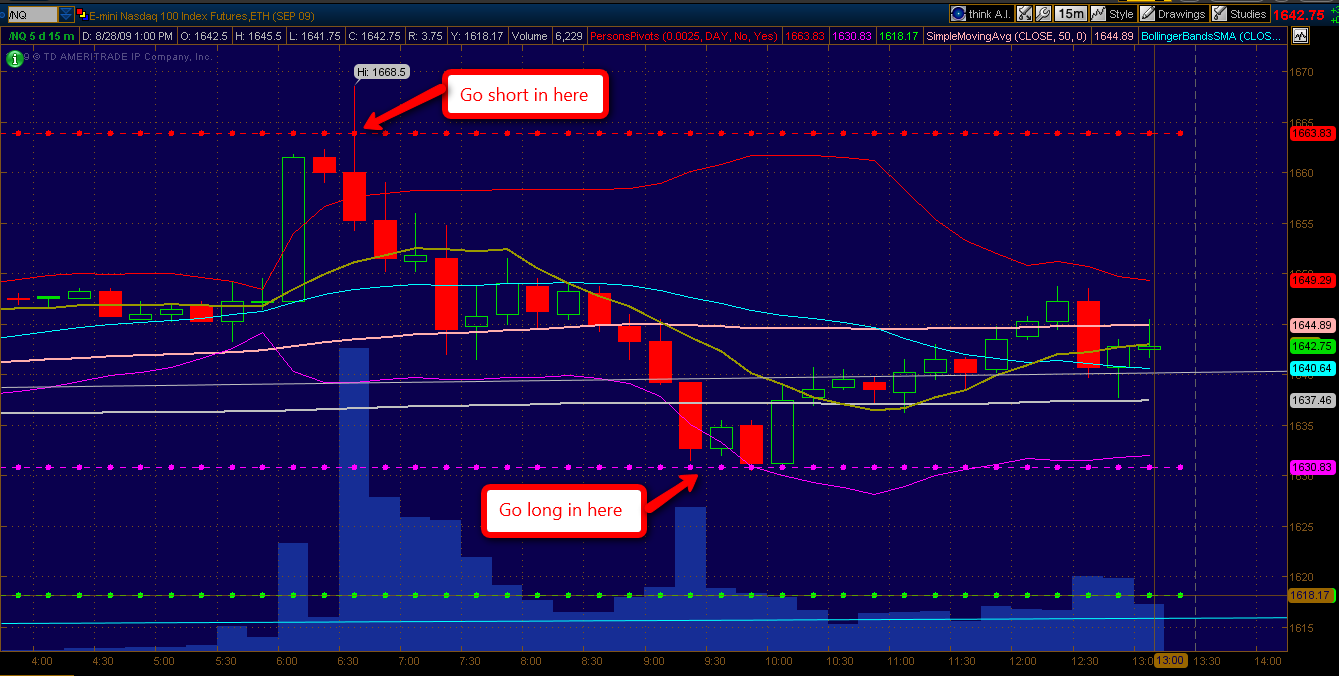
Now, let’s take a look at NQ. I would say NQ is much easier to trade than ES for some reasons – NQ seems to be more TA driven than ES.
This is Friday’s tape. As you can see, you can go short right at R1 level at the openings, and then take a profit at PP level, flip your position and go long, and close the position at the close. Both bulls and bears would have made money by simply using the pivots.
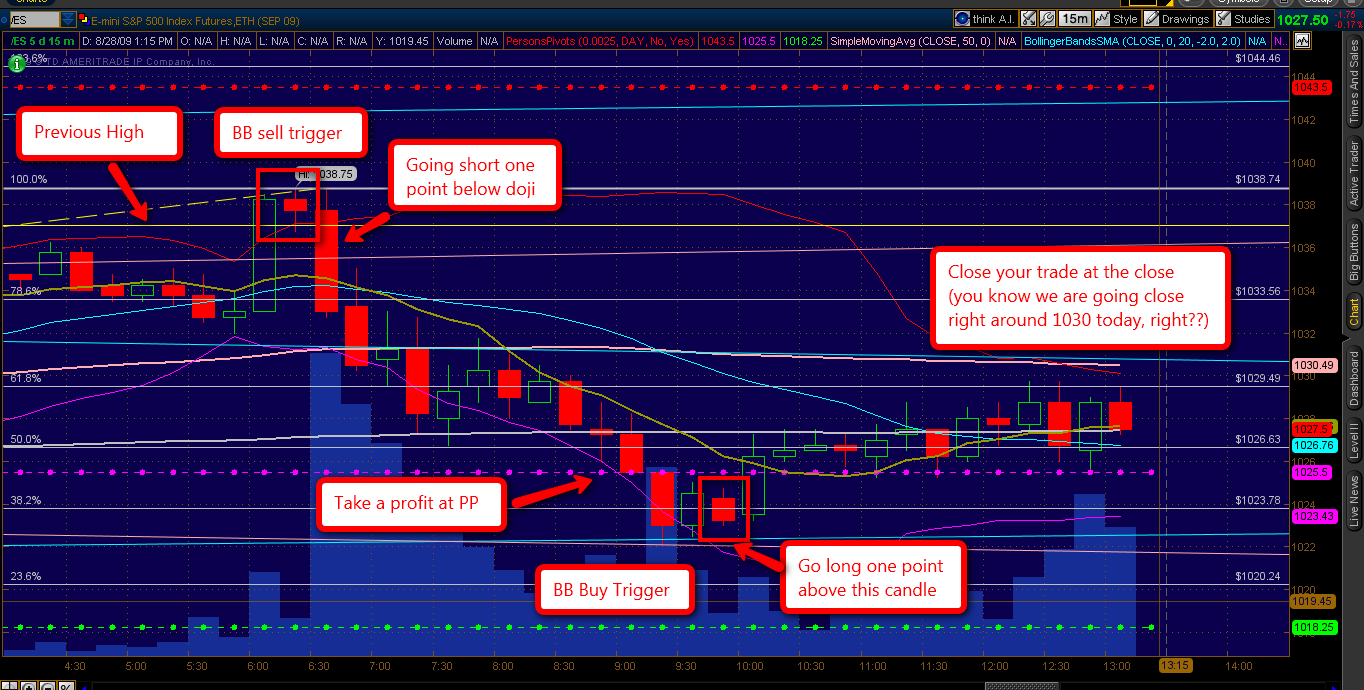
Now, if you look at ES, it’s not as easy as NQ. ES does not follow the pivots as closely as NQ, and you would have to use other indicators to initiate buy/sell signals, and in this case, you can combine BB buy/sell signals as a trigger points.
What I normally do and quite helpful is to look at different indices and ETFs and use the index that follows the pivots closely. In this case, if you are trading ES, look at NQ setup and go short and long based on NQ setup. The timing is quite similar and give you an extra confidence that the market is ready to turn.
Weekend Homework
If you like to study the pivots over the weekend, please check out John Person’s book “Candle Stick and Pivot Point Trading Triggers.
If you have an account with TOS, you can check out the chat archives to see the webinars hosted by John Person himself.
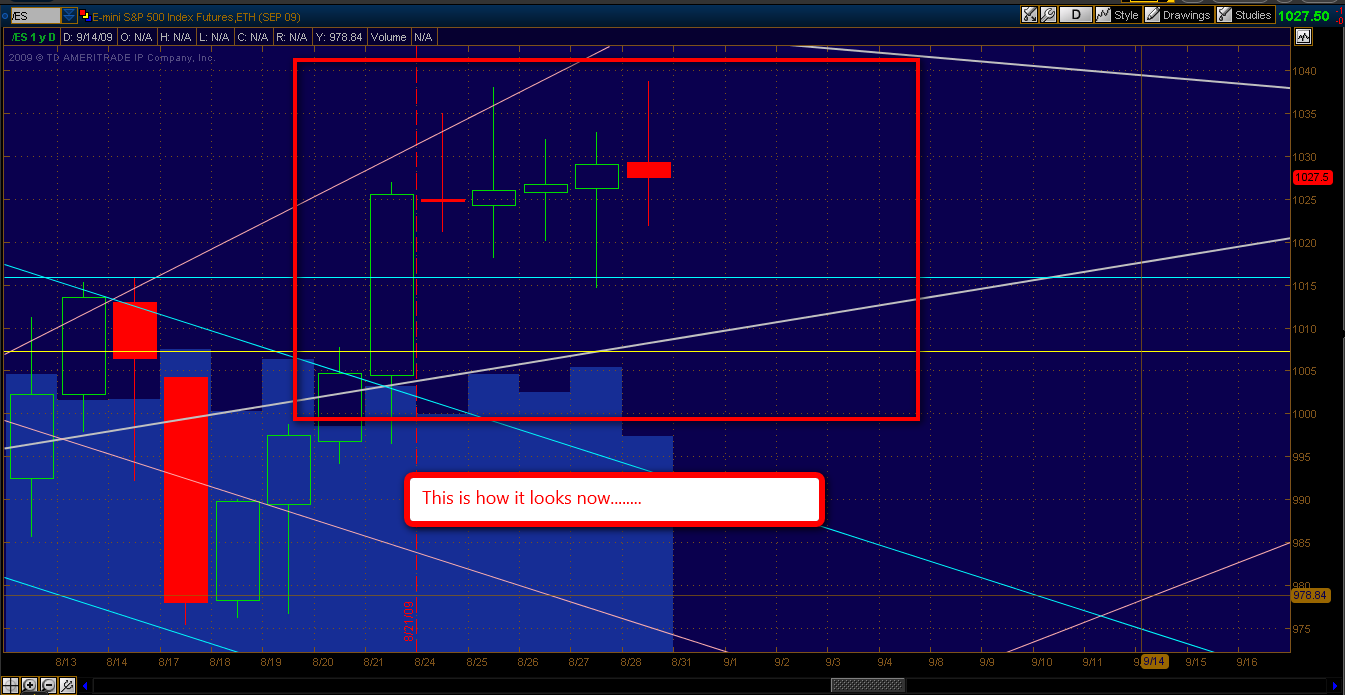
Topping Pattern Formation Update
Here is how it looked back in June.
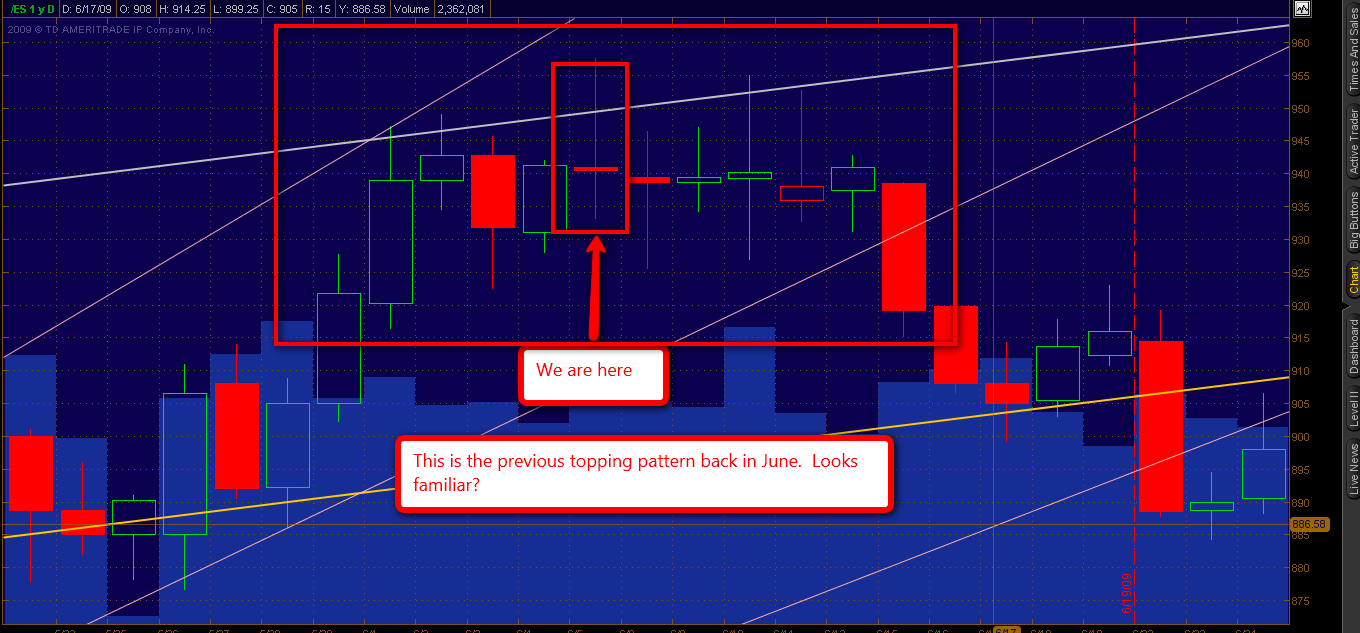
Here is now…. Looks familiar?
Have a good weekend, everybody!


