


Starting To Look Ugly
Starting To Look Ugly
Quite a turn of events yesterday and it once again adds to the growing suspicion we all have regarding the bulls’ case, especially given that we are now heading straight into the low participation summer stretch. With three and a half trading sessions remaining ahead of the July 4th festivities the onus is now on the bulls to pull the cart out of the mud once and for all, lest there will most likely be a price to be paid for all those months of spasmodic mind numbing whipsaw.
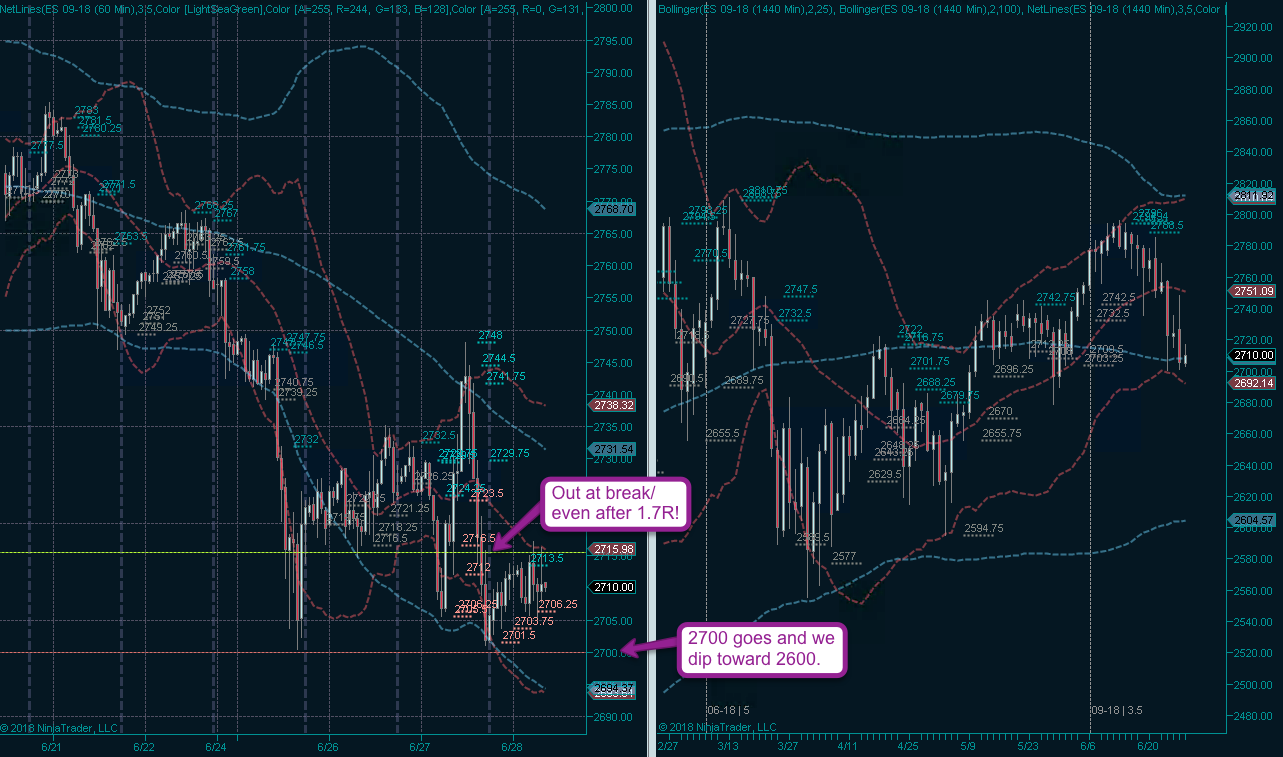
So I ended up getting out at break/even but was still pretty miffed about it as my campaign had scraped 1.7R before things suddenly turned on a dime. I usually advance to 1R at the 2R mark and I rarely modify these rules unless there are extenuating circumstances, e.g. a big policy announcement or a holiday weekend ahead.
It’s pretty simple now going forward. A drop through 2700 most likely puts on the road for 2600, no matter how many twists and turns we may end up taking on the way down. A bounce here could be fun but needs to happen today as I am not getting positioned tomorrow ahead of the weekend (again followed by a big holiday week). Let’s monitor the Zero after the open and if there’s a reasonable divergence I’ll pounce on it, once again however with small position sizing.
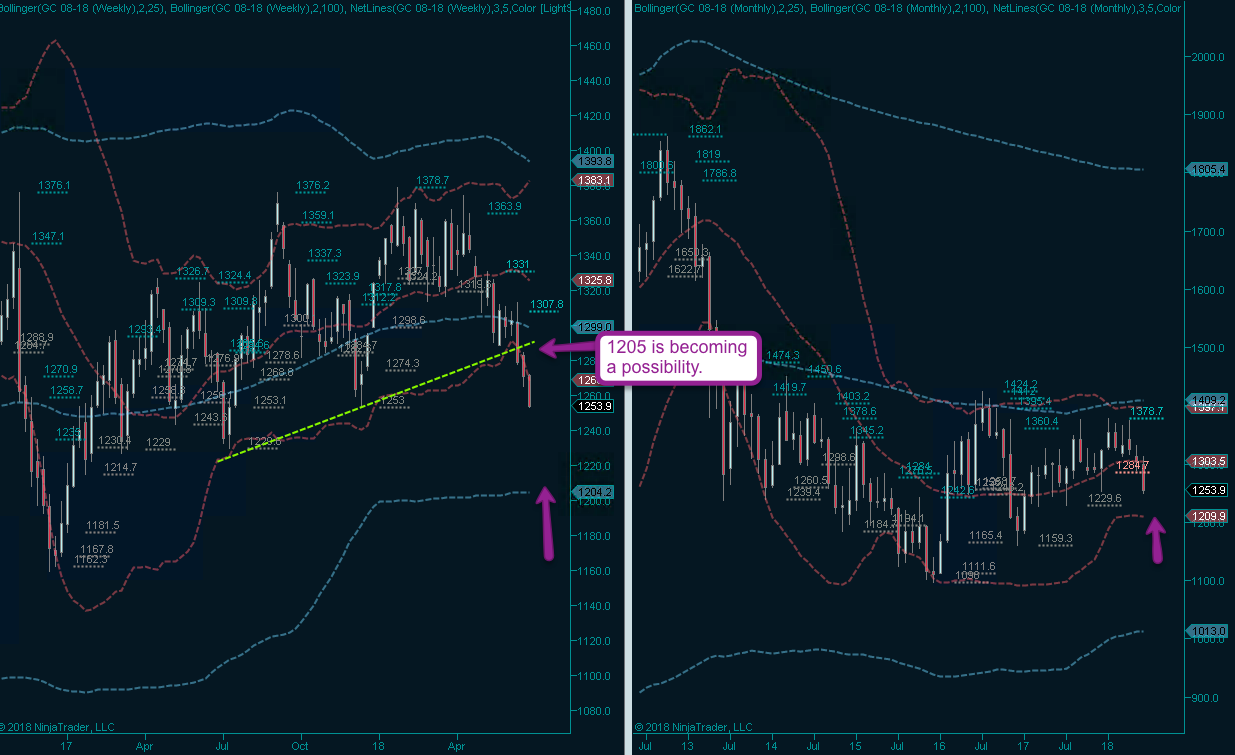
While equities are having a bad year thus far gold has been through hell and back since about 2013. There were numerous opportunities for a reversal since but for some reason nobody ever seems to be stepping up and we are not exactly talking a big market here in comparison with e.g. bonds, forex, or even equities.
When diagonal support on the weekly chart gave way in May (it rhymes – I’m a regular poet!) I suspected that it either would bounce back right away or descend into Hades. And once again gold followed gravity lower with 1205 now becoming a real possibility.

Crude on the other hand is back and on a regular rampage now that it’s in the process of pushing > the 73 mark. There’s nothing but air above and I don’t see any reason why we couldn’t see it test the 90 mark sometime this year.
BTW, this is pretty much textbook from a text reading perspective: A break out phase that produces a final retest a.k.a. the last kiss goodbye after which we see it transition into a trending phase. This is the kind of stuff I am covering in detail in a tape reading video series I have been producing over the past few months. Stay tuned for further updates on that, most likely after the Independence Day celebrations.
Alright, we’re fresh out of freebies, please meet me in the lair for more long term perspectives:

It's not too late - learn how to consistently trade without worrying about the news, the clickbait, the daily drama and misinformation. If you are interested in becoming a subscriber then don't waste time and sign up here. The Zero indicator service also offers access to all Gold posts, so you actually get double the bang for your buck.
Please login or subscribe here to see the remainder of this post.


