


Stocks In Your Stockings
Stocks In Your Stockings
I know that most of you have been rather naughty over the past year, but as I always say: ‘What happens at the evil lair stays at the evil lair.’ Of course as usual I wasn’t about to take any chances. Since ole’ Santa is still using a crusty old Windows XP server as well as unsecured WiFi hacking into his database and erasing any trace of all your evil deeds once again assured us a bountiful and merry Christmas. Which brings me to the special goodie Santa’s favorite evil helper has put into your stockings this year:
Stocks
That’s right, we’ll be trading stock and ETF symbols again. And here’s why: Over the past few years I haven’t been doing much in stocks in particular because I was spending a lot of time on automated system development involving futures and forex symbols. However more stringent Dodd Frank regulations taking effect earlier this year has relegated forex trading to only a handful of major U.S. brokers, thus greatly reducing my audience actually being able to benefit. I was able to compensate somewhat with the CME Forex contracts but unfortunately only a handful of them are liquid enough for our style of trading. The writing was on the wall and it was time to expand my charting universe as very few retail traders trade futures exclusively.
Jumping back into trading stocks however requires me to parse a very large universe of symbols and the filters I found on stockcharts and finviz were unable to produce the type of lens I favor in my daily symbol selection routine. Which is why I held off until one day I happened to run into a new kid on the block which was just in the process of launching an exciting service:
Financhill
What instantly attracted me to Financhill was that they offer statistical and seasonal information along with their charts, which is something that thus far has only been available to institutional traders. I would hazard to guess that over 60% of all NYSE volume these days is produced by purely statistical trading systems. Some may combine their statistical filters with technical information but many of them do not and focus mainly on seasonality and other proprietary statistical data. And here you are out there with your RSA, MACD, or what have you competing with those guys. Good luck.
Until now! Financhill does all the hard work of crunching through data, interpreting results, and displaying key takeaways for easy, instantly actionable insights. Why would you spend days manually parsing for seasonal or historical data if you can have it all at your finger tips right below your chart?
Better information helps you make smarter investing decisions. Period. And there are a lot of free tools for you leeches as well as advanced screening capabilities for even more powerful insights. But it gets even better:
Evil Speculator Portal At Financhill
I was able to convince those guys to build me a custom Financhill portal for my readers with exactly the right indicators and settings I use plus a set of filters that automatically parse tens of thousands of stocks for us every single day. You can find our new portal here and start playing around with it right now.
So let’s get down to business, here’s your very first stock symbol roll call:
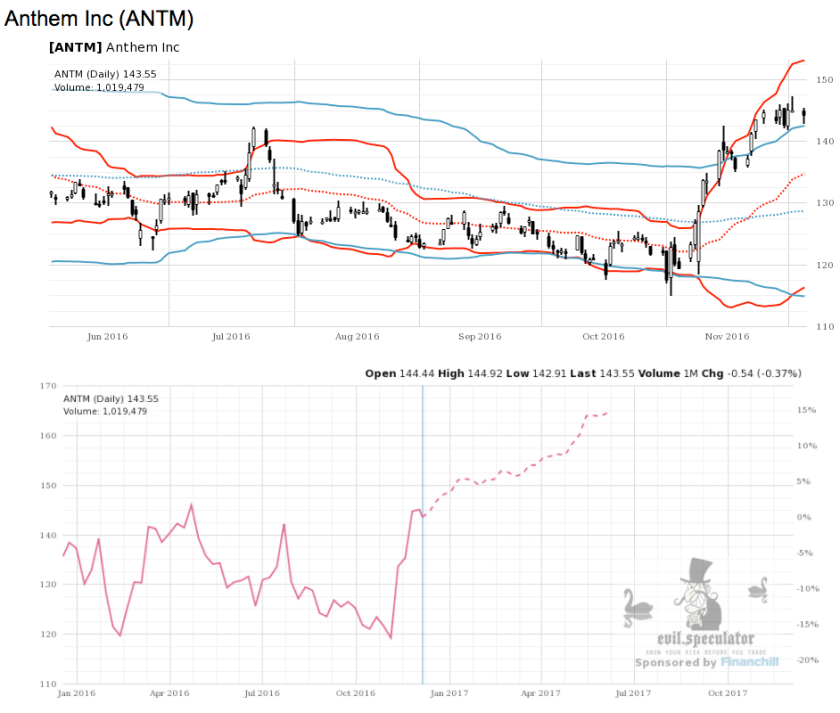
First up it’s important to know that you ca actually click on the chart and get a tab with a dynamic/live chart plus all the statistics. The panel on the bottom shows you a different view which is one of the Financhill chart features I really enjoy. It shows you the seasonality of the underlying symbol which combined with our technical lens offers us an major advantage. On the bottom of that chart you will also find valuable statistical information – in the case of ANTM:
- Over the next 13 weeks, Anthem Inc has on average historically risen by 5.7% based on the past 15 years of stock performance.
- Anthem Inc has risen higher by an average 5.7% in 8 of those 15 years over the subsequent 13 week period, corresponding to a historical probability of 53%
- The holding period that leads to the greatest annualized return for Anthem Inc, based on historical prices, is 2 weeks. Should Anthem Inc stock move in the future similarly to its average historical movement over this duration, an annualized return of 60% could result.
So my setup here is a long position with a stop below 140, which happens to be the 100-month SMA (not shown above).
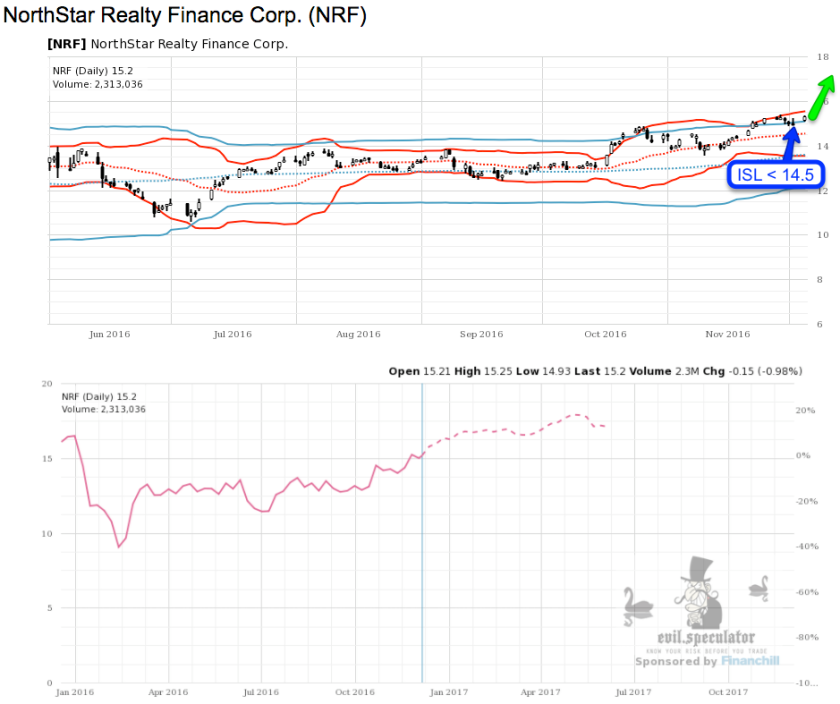
NRF is also a buy with a stop below 14.5. Once again you can click on that chart to get our evil portal and play around with the chart. Seasonality here is pointing upward but not strongly over the next few months. But at least it’s not pointing downward 😉
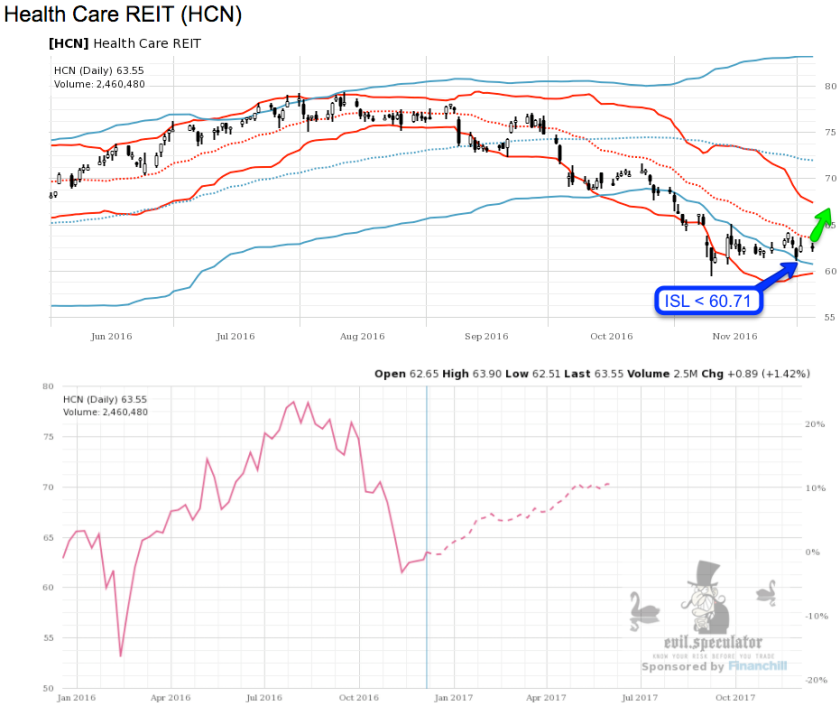
HCN is attempting to paint a floor here and would be another buy with a stop below 60.71 (the previous spike low).
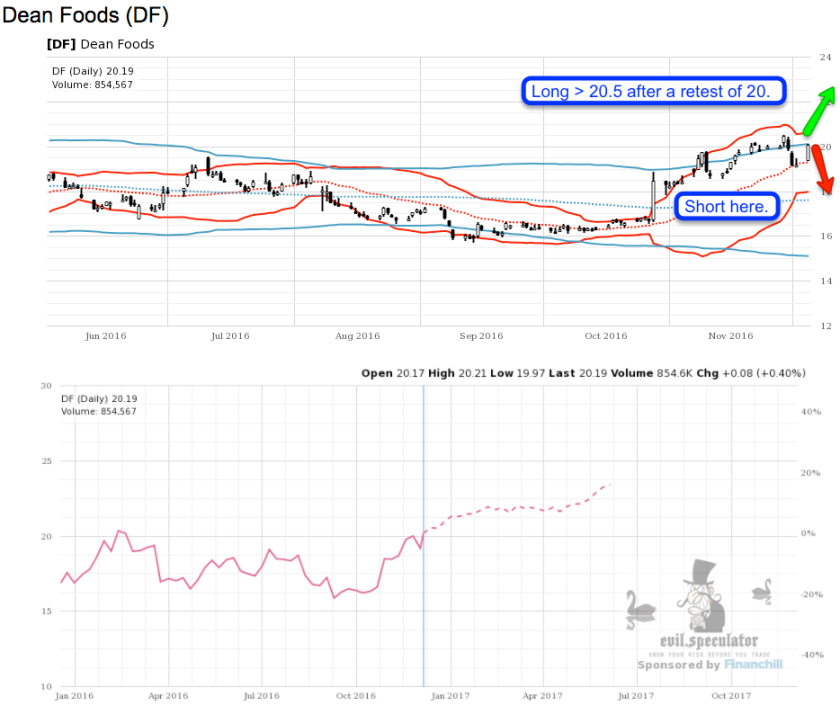
Finally DF is a short despite the fact that seasonality shows us climbing prices for the next months. This is one of the cases where I have to go binary setup as the short formation here has good odds to resolve lower as long as 20.5 remains intact. If that happens then I would want to be long but only after a retest of 20.
I hope you’ll be enjoying your shiny new Christmas present for the remainder of this season and beyond.


