


And The Pitcher Keeps Going To The Well
And The Pitcher Keeps Going To The Well
Alright, so it’s time we take a closer look at the situation across equities. Which is annoying me to no end to be honest any natural laws involving gravity seemingly have been abandoned. It’s not that I want this market to fall as trading up is usually a lot easier than trading down. But while uni-directional market may look like fun on the surface, unless your name is Bill Eckhard it’s a major pain in the rectum for most traders who don’t enjoy buying on the way up.
Looking at any of my momo charts these days makes me think of that old expression that ‘the pitcher goes to the well until it breaks’. Yeah no kidding but this particular pitcher seems to be made out of reinforced 24th century duranium or something. And it’s not that I’m telling you anything new, it’s just that conditions continue to get more and more ridiculous. Let’s not forget that we have already spent most of 2017 stumbling miles deep inside virgin territory in terms of volatility, participation, and most importantly investor sentiment. Corporate junk bonds and equities are all the rage and are steam rolling over any obstacle that may pop its head.
Paradigms Keep Shifting
At the same time I’ve got to tell myself to relax. Reason being is that the constant shift in what Greenspan once referred to as ‘irrational exuberance’ has been an integral aspect of your daily reality as traders for eight years plus now. What in 2008 would have been unthinkable was commonly accepted routine by 2010. And throughout the remainder of this decade the Fed and other central banks repeatedly managed to up the ante so to say by pulling yet another magic rabbit out of the hat.
For the human beings among us traders (I know only few remain) the process of adapting to a constantly shifting playing field in which the old rules simply do not apply anymore is very difficult to accept. And constantly expecting a correction when the market keeps pushing higher relentlessly month after month and year after year isn’t exactly a good recipe for trading success. Fortunately not a mistake we fell prey to, at least post 2010 when I finally saw the light and simply started trading the tape in front of me.
Which however is becoming increasingly difficult if I’m honest. And I’m sensing the same symptoms of exhaustion across our rowdy rabble of participants here on the blog. Whenever we finally get a a down day the comment section explodes and excitement makes itself felt. I don’t think any of you guys call themselves bears but it seems there is a deep seated lingering for seeing some sense of ‘normalcy’ to return to the financial markets. Until that happens however we need to remain as cool as cucumbers and simply do what we have done here one session at a time: Roll with the punches and don’t fall for the rope-a-dopes.
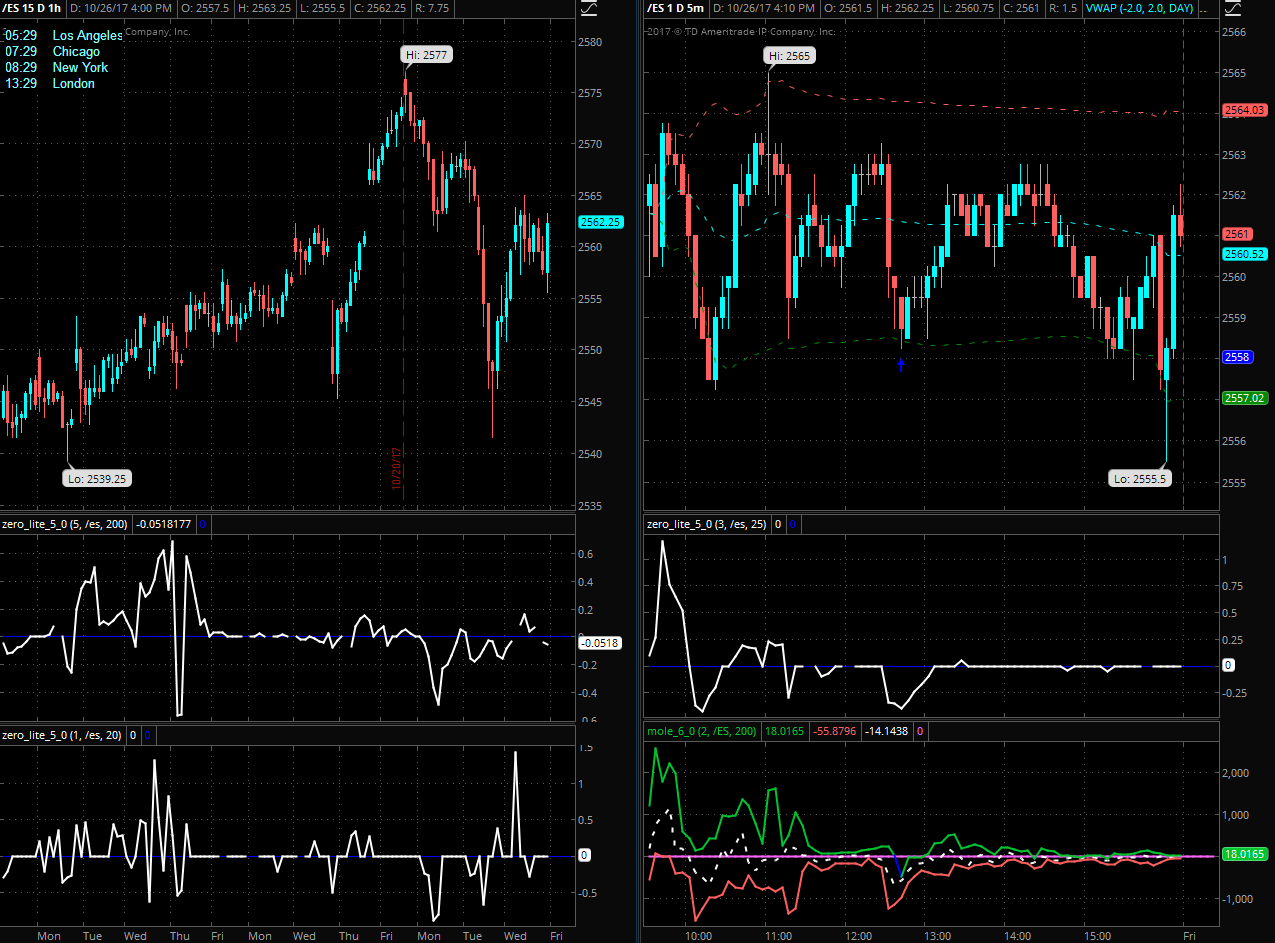
Now let me climb off my soap box and back up my bitching with some actual technical evidence. Starting with the Zero indicator shown above which over the past two sessions has evinced almost zero participation, which makes me wonder what/who is actual driving equities higher right now. Again, I’m not complaining and it’s not that I’m emotional about my stopped out lottery ticket the other day. It’s simply that I like to know what I am up against and when I do not then I usually have no choice but to stay aside.
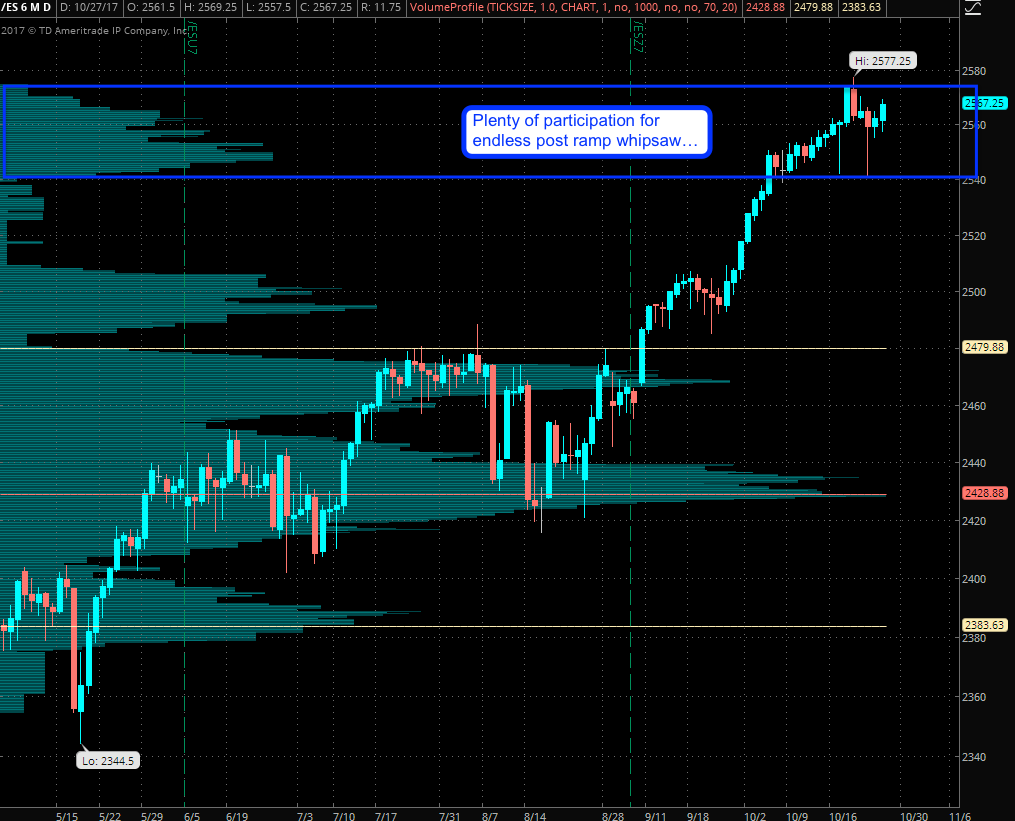
The E-Mini volume panel shows us very little trading volume over the past two weeks but now sufficient has managed to accumulate to almost guarantee us more post ramp whipsaw.
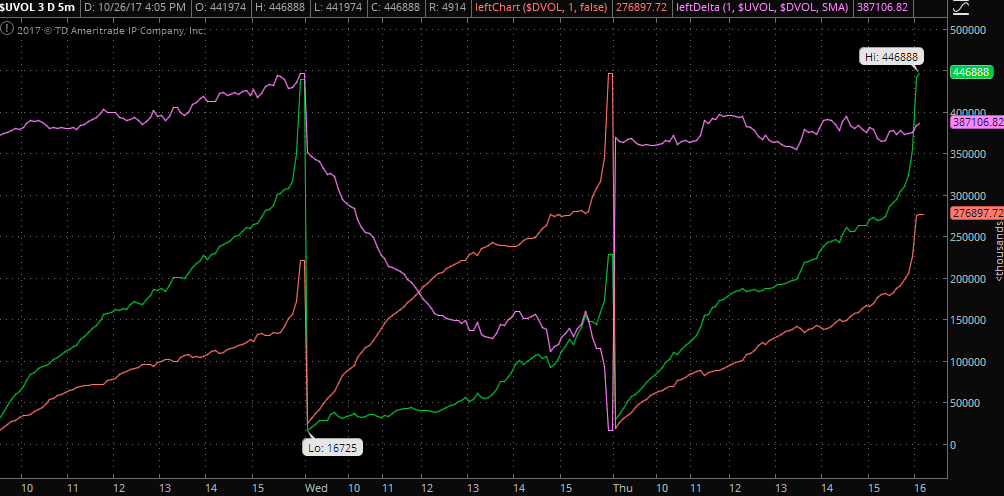
Here’s the UVOL/DVOL panel, pretty solid on the UVOL side I’d say but the net effect was a sideways session which then gets jumped overnight:
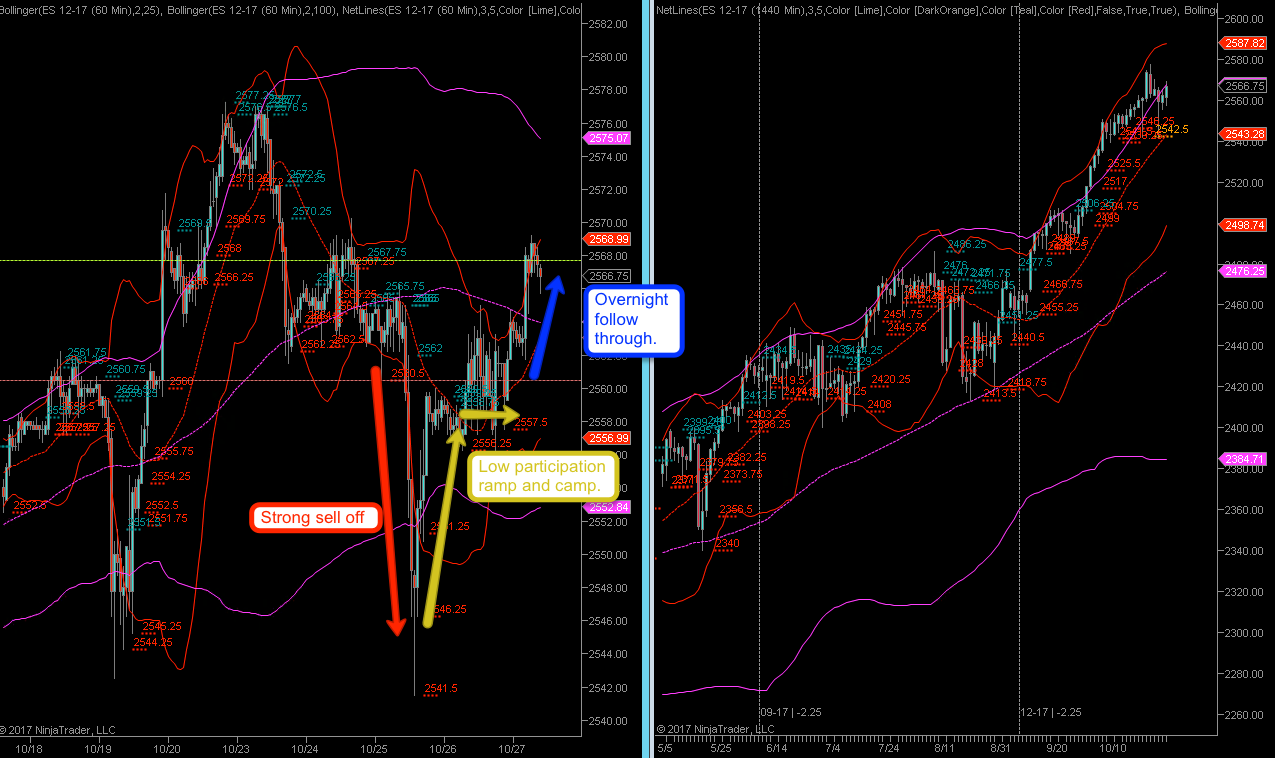
So in summary over the past week we sold off hard with decent participation and bearish momo shown on the Zero indicator and then transitioned into a low participation ramp higher accompanied by a flatline on the Zero. Looks suspicious as hell and in the old days I would have been shorter than a field mouse. However…

The YM barely broke a sweat earlier this week and this is not type of market I would feel comfortable selling. Which of course is great for quick surprise wipe outs but unless you are able to catch the fleeting dips then you’re SOL.
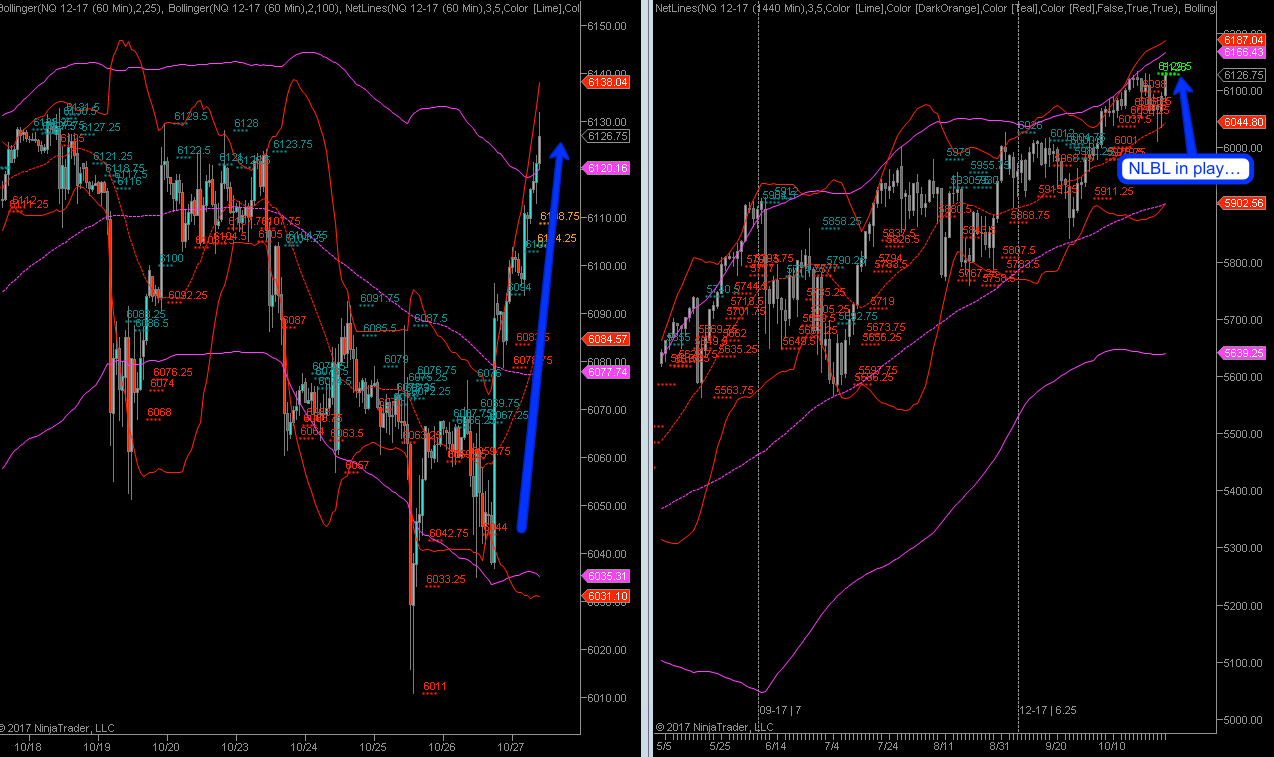
Here’s the NQ – which is pointing up up and then up.
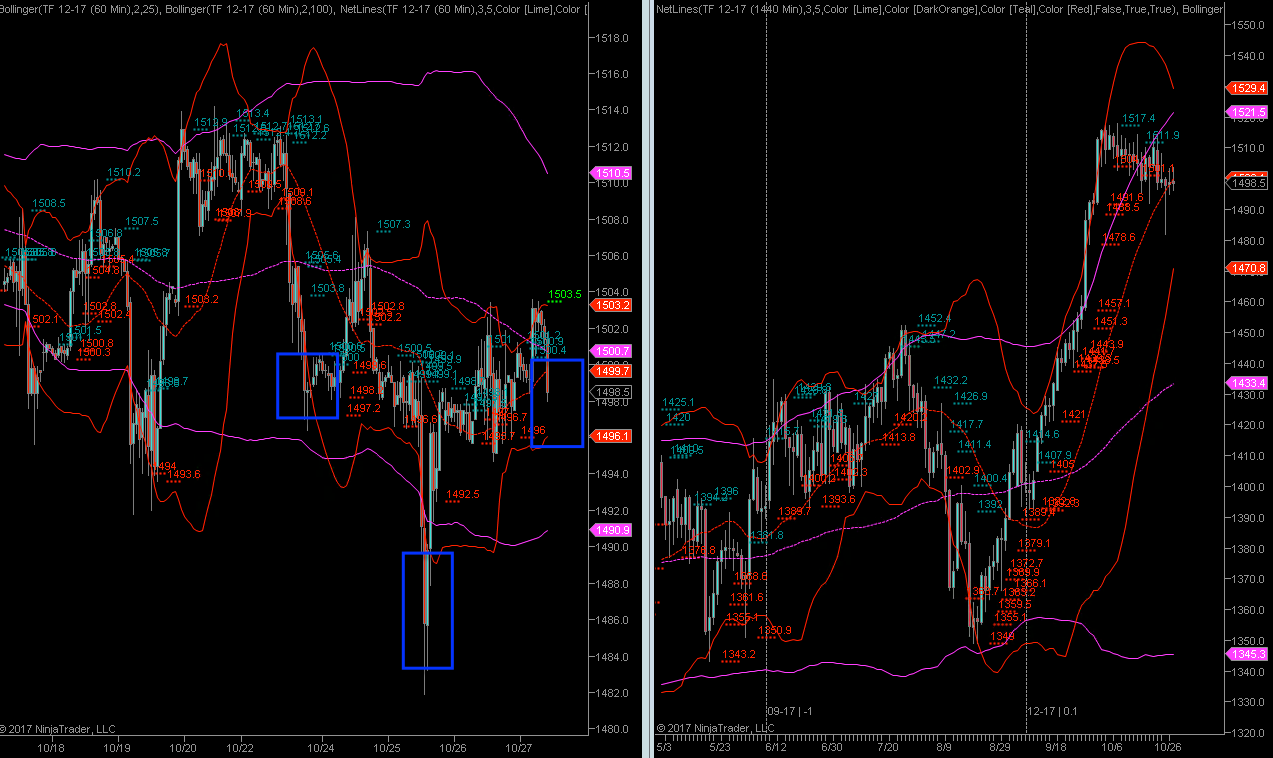
The TF seems to be the laggard among the group but even here I’m seeing a very juicy inverse H&S that may be worth taking. Maybe – but most definitely not on a Friday.
Let me finish the week with a few volatility related momo charts below the fold:

It's not too late - learn how to consistently trade without worrying about the news, the clickbait, the daily drama and misinformation. If you are interested in becoming a subscriber then don't waste time and sign up here. The Zero indicator service also offers access to all Gold posts, so you actually get double the bang for your buck.
Please login or subscribe here to see the remainder of this post.


