


The Wheels Are Coming Off
The Wheels Are Coming Off
It seems that the wheels are finally coming off this carefully managed market. I think we all know that the writing has been on the wall for a while now. In recent weeks the bulls managed to fumble several important inflection points and bounces near important lows have become weaker and more sporadic. That may be forgivable once or twice but at some point there will be a price to pay. We have a ton of material to go through today – I promised you a long term update and I’m actually glad I waited another day as we are at the cusp of a potential trend change – medium term most likely and perhaps even long term.
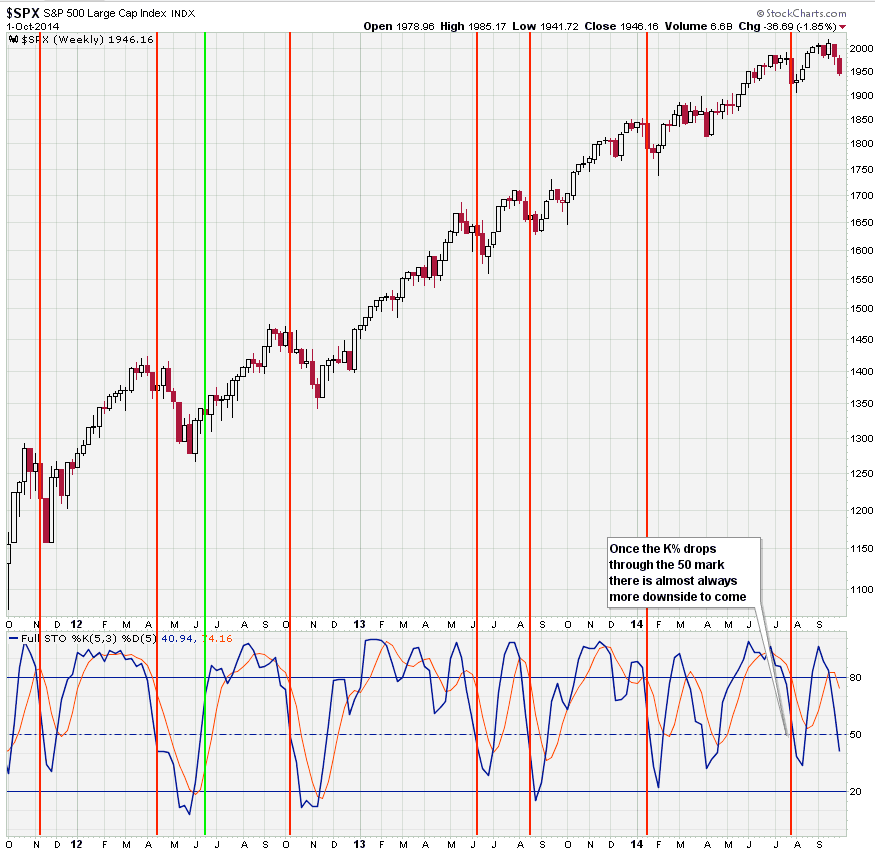
Let’s start with the easy (but reliable) stuff – our weekly stochastic on the SPX. I’m sure many of you use that indicator – but very few actually know what makes it tick. It’s rather simple – a stochastic follows the speed or the momentum of price. As a rule, the momentum changes direction before price. So it’s not so much about where the line is right now – it’s about how it correlates with price movements.
If you’ve been coming here for a few years now then you probably remember this chart and you probably also know that I rarely use neither a stochastic nor a MACD in my daily charts. I think they’re generally overhyped and almost always lag behind. On the weekly side however it’s been a great tool for confirming trend changes – it rarely fails.
The only times it did fail were actually earlier this year when the K% line touched the 50 mark twice (it’s an oscillator really not an indicator) and then bounced back higher. Very very rarely does this actually happen – in most cases we see more downside after that. Not always a touch of the 20 but always more significant downside. I am not going to resort to speculation or conspiracy theories here – that’s not my style. But that said – equities have had a lot of help in the past few years and these things are to be expected. They often however also point toward the formation of a medium term or even long term topping pattern.
Markets can not bubble higher forever – corrections are healthy and are needed. It is a fact of general market dynamic that many investors would like to ignore and often irrational exuberance can frustrate hardcore technical traders for longer they would care – or perhaps afford. We here at Evil Speculator may be hardcore but we have long learned that lesson and that has served us extremely well over the past few years. However, we must also not fall into the trap of recency bias – even on the long term side. So let’s consider what other evidence is on the table right now – and there happens to be plenty.
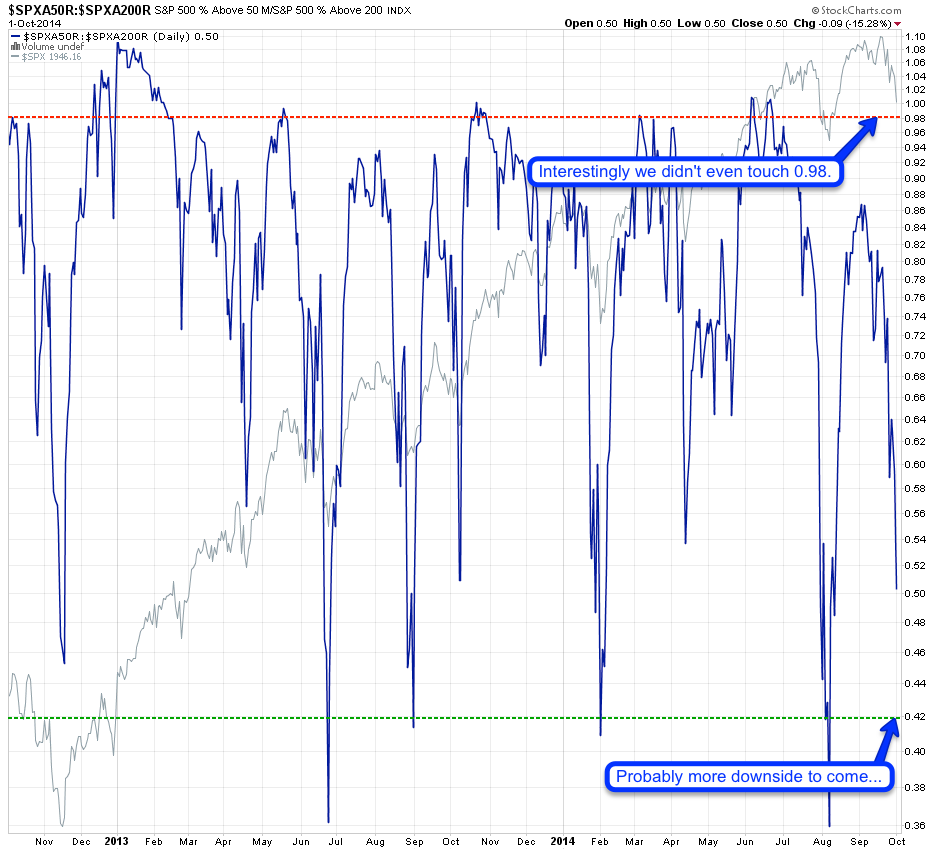
So let’s move on to breadth – here’s the SPXA50 vs the SPXA200 – it shows us how many stocks in the SPX are trading above their 50-day SMA vs. the ones trading above their 200-day SMA. Basically you plot the 50 against the 200 in order to know when the 200 is falling behind. Some people have a problem understanding ratios but they are pretty simple if you think it through – on one hand – on the other they can also be complicated.
The 50 gets divided by the 200, right? So if the 50 is dropping and the 200 remains the same then then we know that stocks are still above their 200 but more are falling through their 50. For example if the 50 is at 1.0 and the 200 at 1.0 we get 1.0. Now what happens if the 50 drops to 0.8 and the 200 only to 0.9? Now we dropped to 0.89.
It’s not my intent to give you an algebra lesson, but my point is to start thinking of how momentum works. Because let’s say the 50 goes to 0.9 and the 200 remains at 1.0? That’s good isn’t it? More stocks above their 200 is a good thing, right? Well, not really – because now man of those sticks are approaching the 200 SMA. If you do the math the ratio comes out to 0.9, so technically we’re very close to where we were. Remember that the 200 is a lot slower than the 50 and initially the latter is easier to recover – as stocks draw lower however it becomes harder and harder.
The 50 is easier to recover after a quick fall – so sometimes you get a quick drop and a ton of stocks fall through their 50 SMA. The same stocks may be mostly still be above their 200 and after a few trading days they may manage to recover the 50. So all is good again, right? No – because we are now closer to the 200 on many fronts and the next time a good number of stocks drop again some of them will take out the 200 as well. So it’s a bit of a complex interplay between two moving averages. Just imagine in your mind the 50 gyrating above its 200 – both represent general smoothed price dynamic and the ratio between them tells us about the health of the market.
Another aspect of breadth our outliers – you may often have a core of outliers that keeps the indices at a certain mark – stocks like AAPL, AMZN, or most recently BABA. Their high valuations may distort the real story behind the remainder of this index’s underlying health and momentum – but breadth tells that story clearly.

Here we play the same ratio game on the NYSE. I am having a harder time drawing any conclusions on this one but thing is clear: the dynamics of market behavior seems to be shifting. Just watch how the 2013 advance extended into early summer and then suddenly something broke. What we are now seeing could very easily be the beginning of a underlying shift in market dynamics. If your portfolio is still heavily leaning toward the long side (i.e. delta positive for option traders) then I suggest you start paying attention as to not outstay your welcome.

Here we are looking at the NYSE declining vs advancing volume. Yes you guessed it – breadth again – same idea. But we are measuring NYSE volume this time and it tells us about the vehemence of the ongoing move, to the up- and downside. It’s been pretty contained in the past few years and even right now there’s no real sense of a panic. Complacency still rules the day.

On the VXV:VIX we measure 30-day vs. quarterly implied volatility. In essence this tells us how market makers feel about the next 30 to 90 days. It’s been a bit of a ping-pong game in recent years and the best I can tell you right now is that we are probably going to head down a bit further before we see a short term bounce.

The VIX:VXO is more focused on the next few weeks and we also seem to have more downside momo available to us. So be very careful in picking lows here, you may be overwhelmed by unexpected market behavior which we have not seen in recent years. I’m not saying a bounce cannot happen here – I’m actually covering that further below. But don’t jump to conclusions and expect the same BTFD behavior as in recent years. Investors are clearly a bit rattled and it’s not business as usual as in recent years.
Alright more long term goodness below the fold – please step into my lair:

It's not too late - learn how to consistently trade without worrying about the news, the clickbait, the daily drama and misinformation. If you are interested in becoming a subscriber then don't waste time and sign up here. The Zero indicator service also offers access to all Gold posts, so you actually get double the bang for your buck.
Please login or subscribe here to see the remainder of this post.
Alright, all that ought to keep you guys busy for a while. Seems like it’s going to be a fun fourth quarter. Let’s get that money!
Cheers,


