


Thor Back Tested Past Five Years
Thor Back Tested Past Five Years
After presenting Thor.0 some of you guys wanted to know what the long term track record is as it’s always important to see how a particular strategy performs in various market conditions. Well, I’ve been a very busy bee this weekend and am ready to deliver the goods. And not just that – I devoted over six hours of my day today running five years worth of backtests on Thor as well and the results were rather stunning. But let’s start with Thor.0 first:
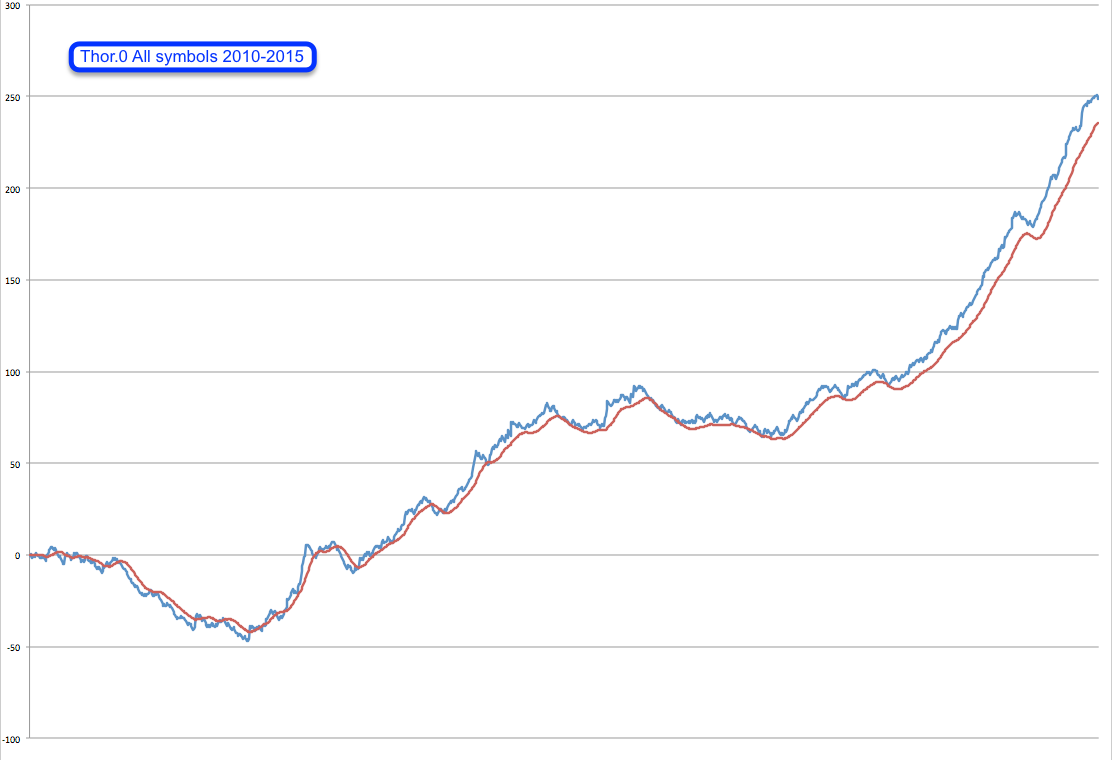
This is it – Thor.0 running on all 38 symbols over the past five years which produced a total of 250R. If you consider compounding that would have turned $100k into nearly half a million. By the way that is about 800 full campaigns – 1370 entries but Thor is forced to go in/out four times in a 2R+ campaign due to a NinjaTrader bug that prevents us from taking partial profits. Hopefully they’ll fix that issue once they finally release NT8 (sometime in 2020 – hehe).
What stands out here of course is that nasty draw down in 2010 – not a happy year if we just had started out (I think this is exactly what happened to Bill Dunn). However the good news is that Thor.0 exhibits high dependency and therefore is a great candidate for employing an equity curve filter. What I mean by high dependency is that it remained below its 20-day SMA throughout the entire drawdown. See the original article and also my write up when I implemented one into CrazyIvan (which still runs today). Well, and as it so happens Thor.0 shares a codebase with CrazyIvan, and therefore the EC filter is already built-in. It even considers live trades which is essential in trend trading systems like this one. So if market conditions revert to what we experienced in 2010 then it’ll automatically shut itself off for however long necessary.
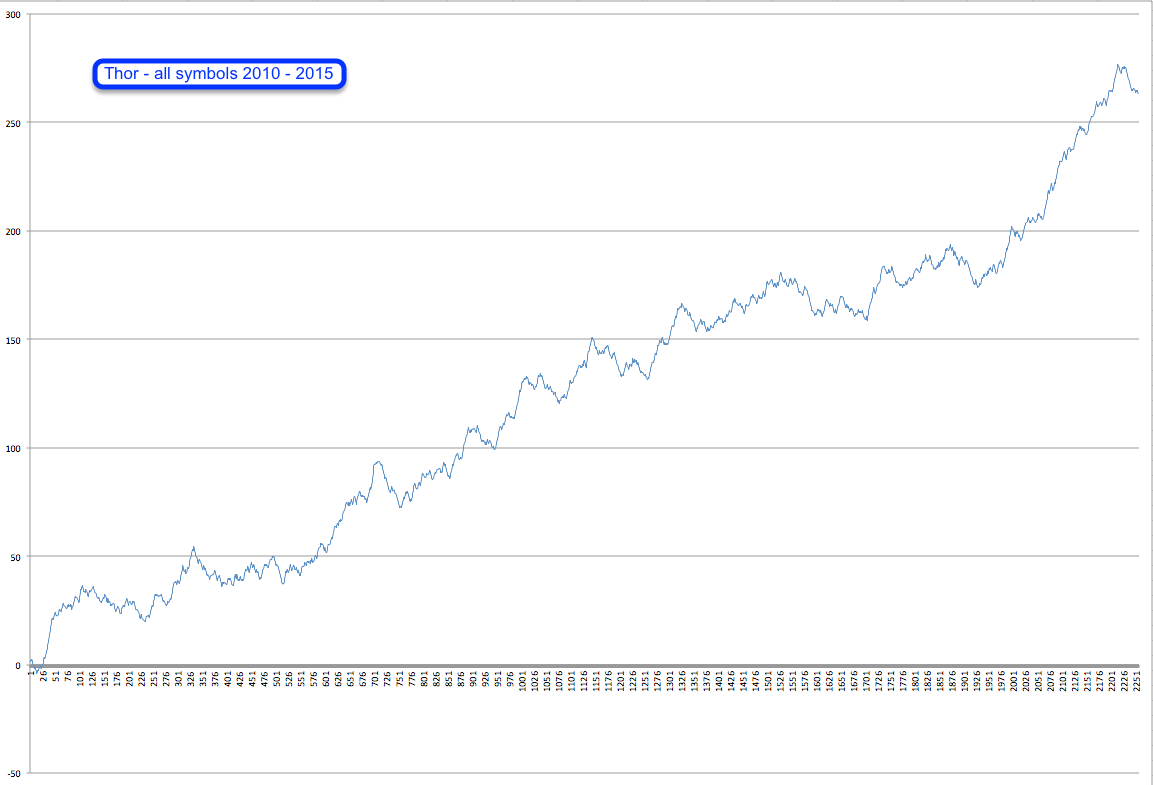
Now here is the original Thor strategy – every single campaign on every single symbol over the past five years. As it stands today 265R in about 1500 campaigns. I absolutely love that solid curve upward through a variety of market conditions. However the effort really paid us some unexpected rewards as we realized that there are were a handful of symbols which had been clear under performers in the past five years. Quite simply they have not been conducive to trading Thor and should be left out until they enter a compatible market phase.
Which by the way is nothing unusual and an approach employed by Ed Seykota – instead of trading a static set of symbols he constantly evaluates a small universe of symbols and only trades the ones in line with his strategies’ requirements, i.e. most likely trending in Ed’s case – he’s a proud trend trader and even sings about it:
That’s right – one trend pays for ’em all! But in our case actually quite a few more:
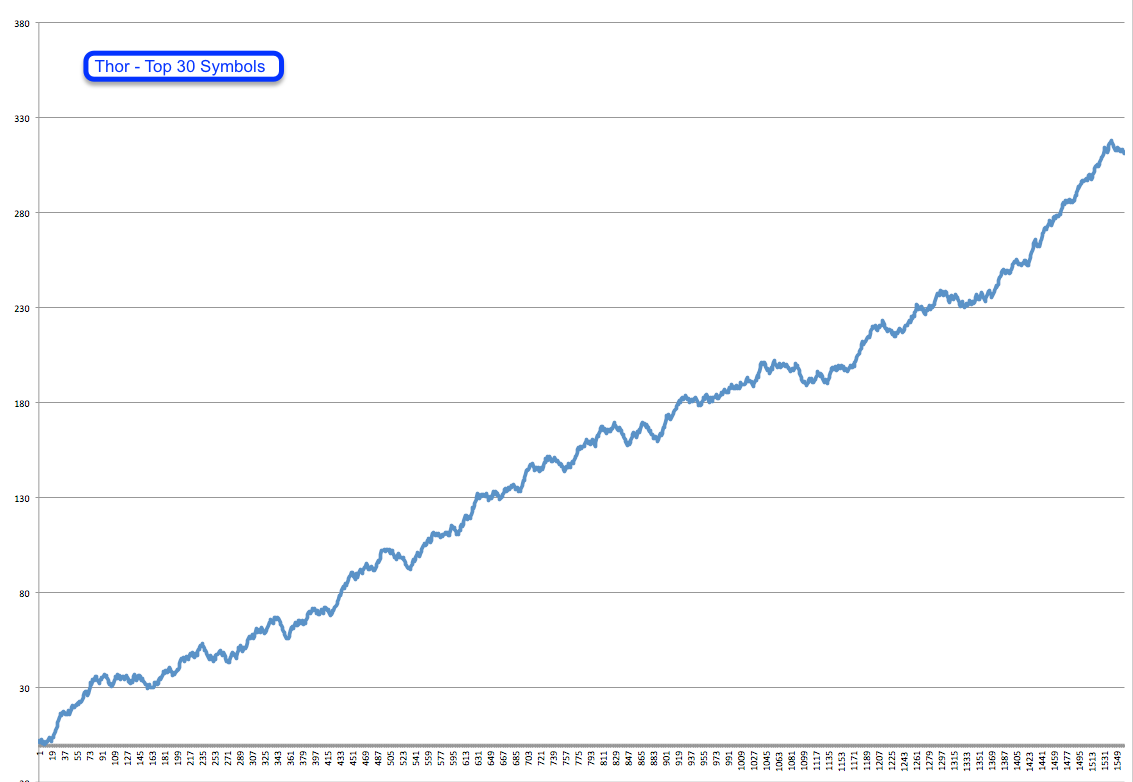
This is what happens when you start excluding 10 underperforming symbols. 311R over the past five yea and let me assure you that this is not courtesy of form fitting. We have only excluded symbols which have been continuously pointing down for the past four years – like for instance this one:
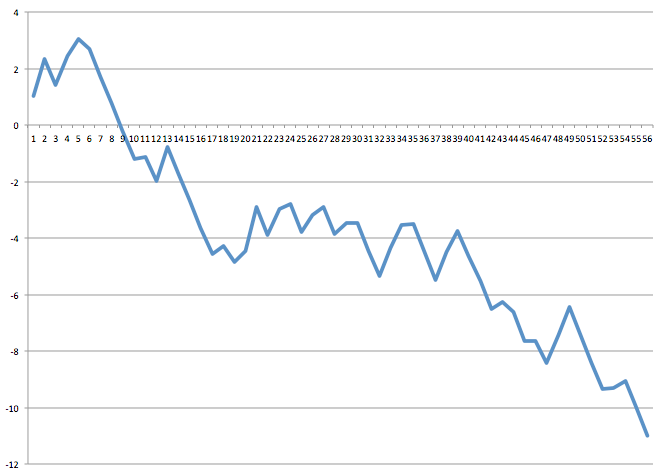
That’s AUDCAD and it’s been pointing down continuously for the past five years. Bear in mind that this one is actually included in the first Thor chart. Hard to believe really. So the approach we have decided to follow is to run a backtest on all symbols currently on our blacklist once per month and decide whether or not to include them again. The requirement for AUDCAD would be that it’s starting to point up and looks like it has entered a positive phase. Employing an SMA approach here would be difficult and we prefer to do it manually.
So there you go – all the stats on Thor and Thor.0 for the past five years. Personally I’m super happy with the results – what do the rest of guys think?

It’s not too late – learn how to consistently bank coin without news, drama, and all the misinformation. If you are interested in becoming a subscriber then don’t waste time and sign up here. The Zero indicator service also offers access to all Gold posts, so you actually get double the bang for your buck.
Cheers,


