


Updated Market Map For June
Updated Market Map For June
The market never ceases to surprise even the most savvy and experienced of operators. Merely an hour after I posted a fairly bearish medium term outlook on equities the market reversed in its track and embarked on a massive short squeeze that ended the session near the crucial SPX 2800 mark.
So of course the next question I expect you to ask if the bear is done for the summer. Tough to predict but what I can offer are several price thresholds that will affect the balance between the bulls and the bears.
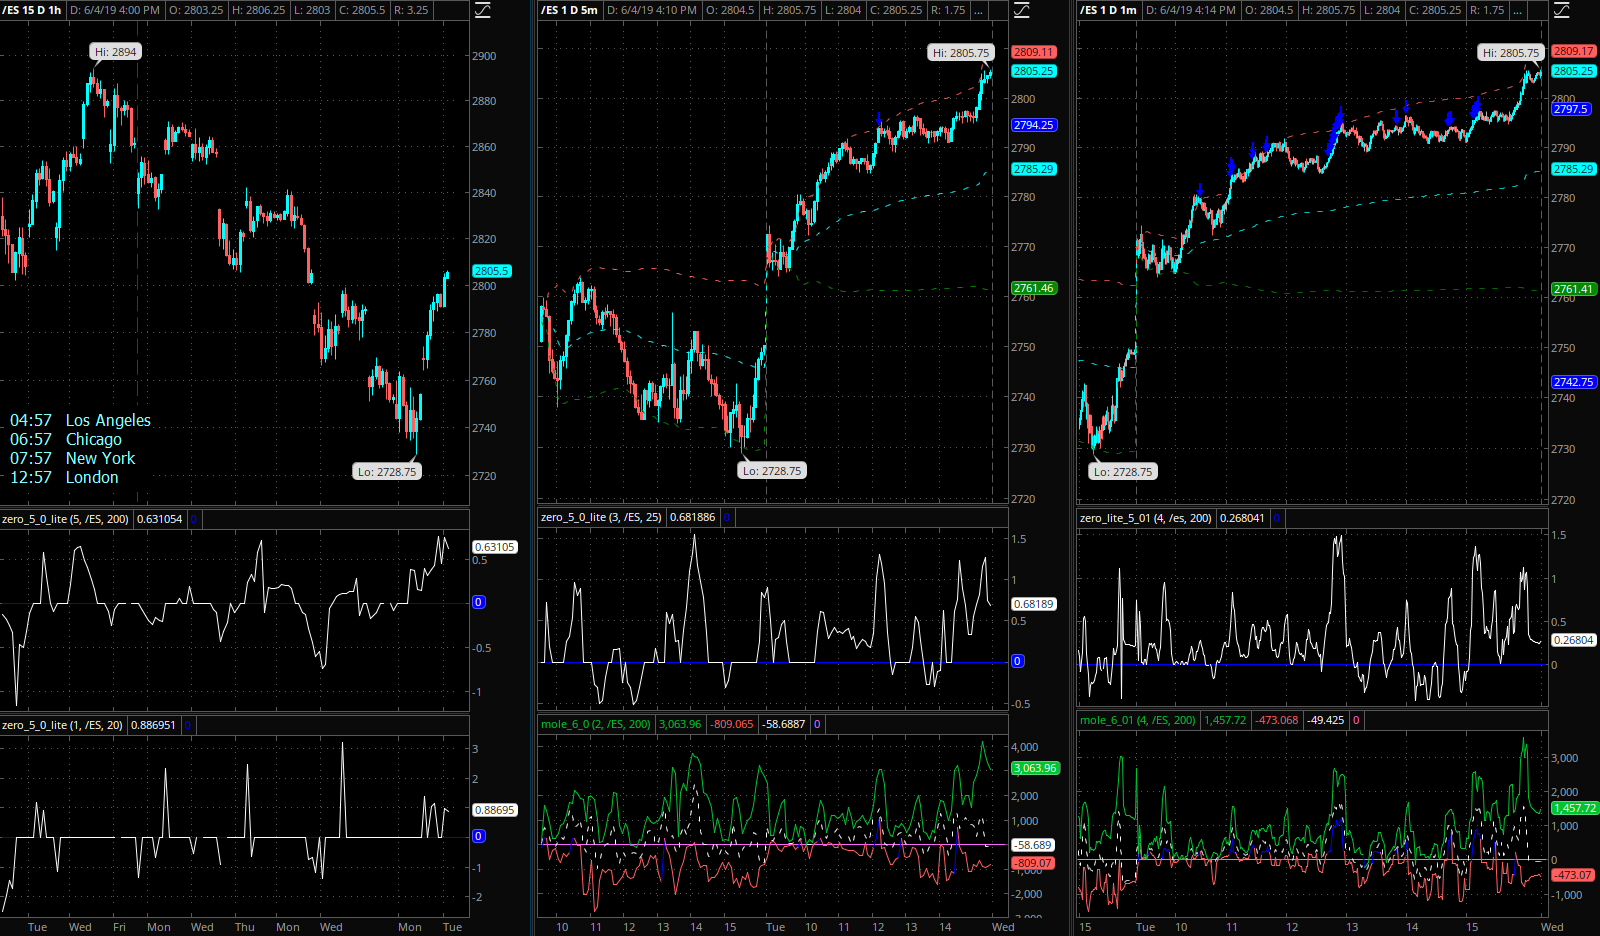
First up here’s a glance at yesterday’s perspective on the Zero indicator. Solid positive signal almost throughout the entire session and VWAP was never as much as touched. Typical short squeeze up trending day, which is when you completely ignore any signal divergences and simply hold long into the close. The same of course applies to trading the downside.

Now here’s a handy map which I already spelled out yesterday in the comment section. Our thresholds here are as followes:
- ES 2800 (where we are now – more or less): The bears are officially put on notice but it’s still possible that we’re painting a snap back rally inside a more extended bearish cycle.
- ES 2850: The bears are now in trouble as we’re basically reversing over 50% of the down leg, and possibly in only two or three sessions. Sellers need to step in here or the bulls are back in control.
- ES 2900: A big psychological threshold that hands control back in the hands of the bulls.
The stakes could not be any higher here as a failure of the bears here will most likely lead to a breach of the double top on the daily panel (i.e. a push beyond the coveted 3k mark).
The bears are not dead yet – not by a long shot. But in order to maintain the perception of an extended bearish cycle any rips need to be slapped down with utmost prejudice. Continuation higher from here (as we are witnessing this morning) weakens the bearish case IF it breaches > the 2850 mark. Until then the odds of a counter rip inside a bearish cycle are still high.
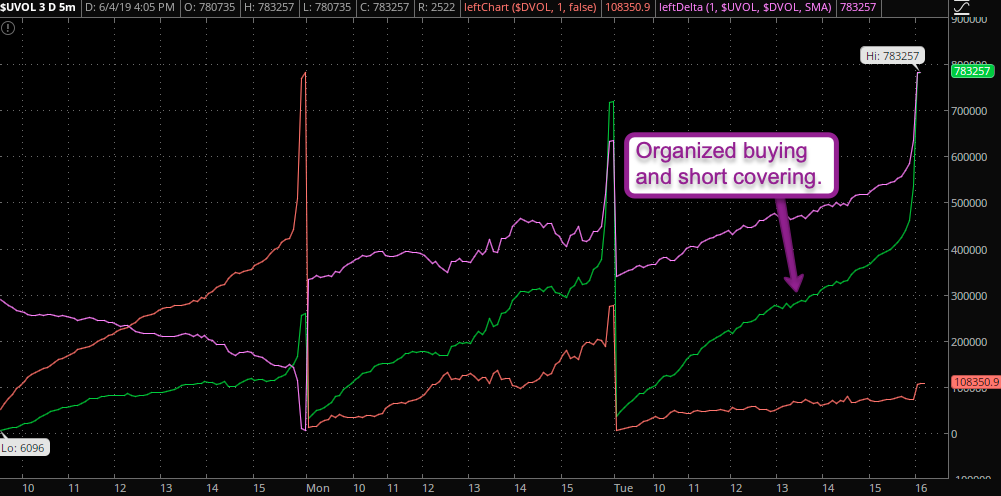
UVOL shows us organized buying pressure throughout the entirety of yesterday’s session.
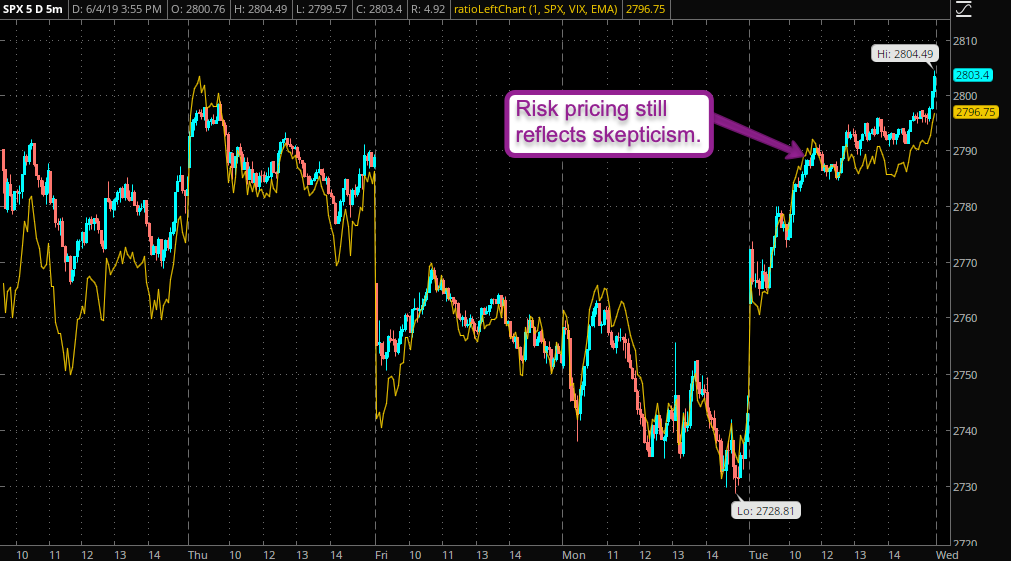
This is the one chart that still irks me a little. At least judging by the SPX:VIX ratio option prices still reflect quite a bit of skepticism. I’ll keep an eye on this one today, for sure.

I won’t pretend that I saw this one coming as my mamo charts didn’t reflect any pressing reason for a bounce. And from a pure price perspective a drop toward ES 2650 would have made a lot more sense. Of course I’m the first one to always expect the unexpected, but until ES 2900 has been breached I remain a bit skeptical.

Quick update on crude: A floor pattern seems to be in the making and I’ve now pushed my trail to 1.25R, which has high odds of being touched today.

It's not too late - learn how to consistently trade without worrying about the news, the clickbait, the daily drama and misinformation. If you are interested in becoming a subscriber then don't waste time and sign up here. The Zero indicator service also offers access to all Gold posts, so you actually get double the bang for your buck.
Please login or subscribe here to see the remainder of this post.


