




Nvidia is sitting at three-month highs on a thesis that needs basically everything to go right for the next two years. Morgan Stanley just told you to buy it anyway.
The stock is up about 5% on the week, within pennies of $236. That part is easy to see. The argument underneath it is more interesting. And considerably more fragile.
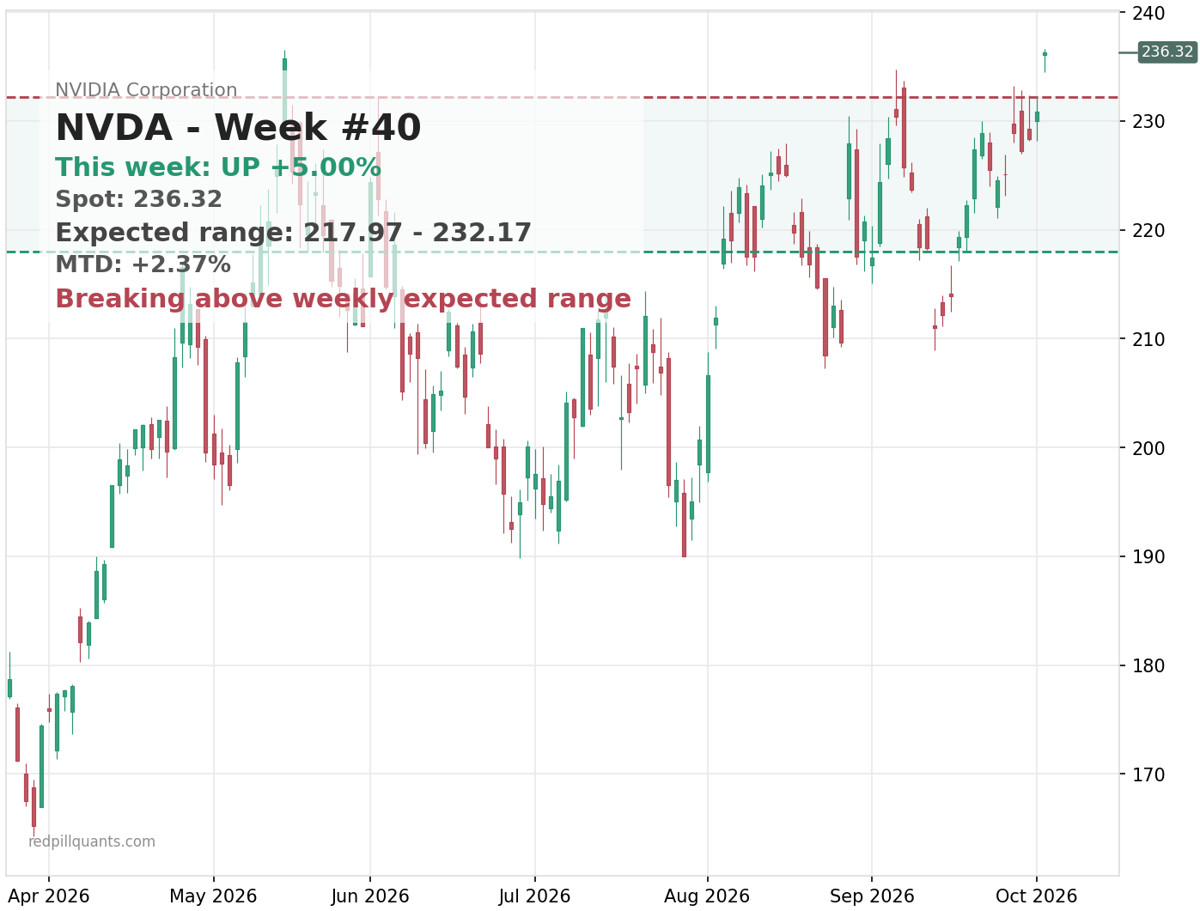
The thesis isn’t that Nvidia is cheap because AI spending is accelerating. Everyone already knows that part. The interesting claim is that the bottleneck has shifted. For the past two years, the constraint on AI buildout was chip supply. How fast can Nvidia manufacture and deliver?
That bottleneck is moving. The new one is data-center construction and power capacity: how fast hyperscalers can actually build the facilities to absorb all these chips.
If that’s right, it changes the growth ceiling entirely. Nvidia’s output is no longer the limiting factor. Available power is. That’s a different kind of problem, and one that’s largely outside Nvidia’s control. Which is a polite way of saying the bull case now depends on the electrical grid. Sleep well.
The valuation math rests on 15x FY2028 earnings, against roughly 70% revenue growth guided for that year. Looks great on a spreadsheet. The catch is that both the multiple and the growth estimate are anchored to projections two years out, and they depend heavily on Vera Rubin,
Nvidia’s next-generation GPU architecture, actually delivering the efficiency gains everyone is currently assuming it will. That’s a lot of faith in a chip that hasn’t shipped yet. It doesn’t make the thesis wrong.
It makes it a bet on execution over a long horizon, not a near-term value play. Worth knowing which one you’re making before you size anything.
Large-cap tech is behaving. The part of the market that isn’t is small-caps.
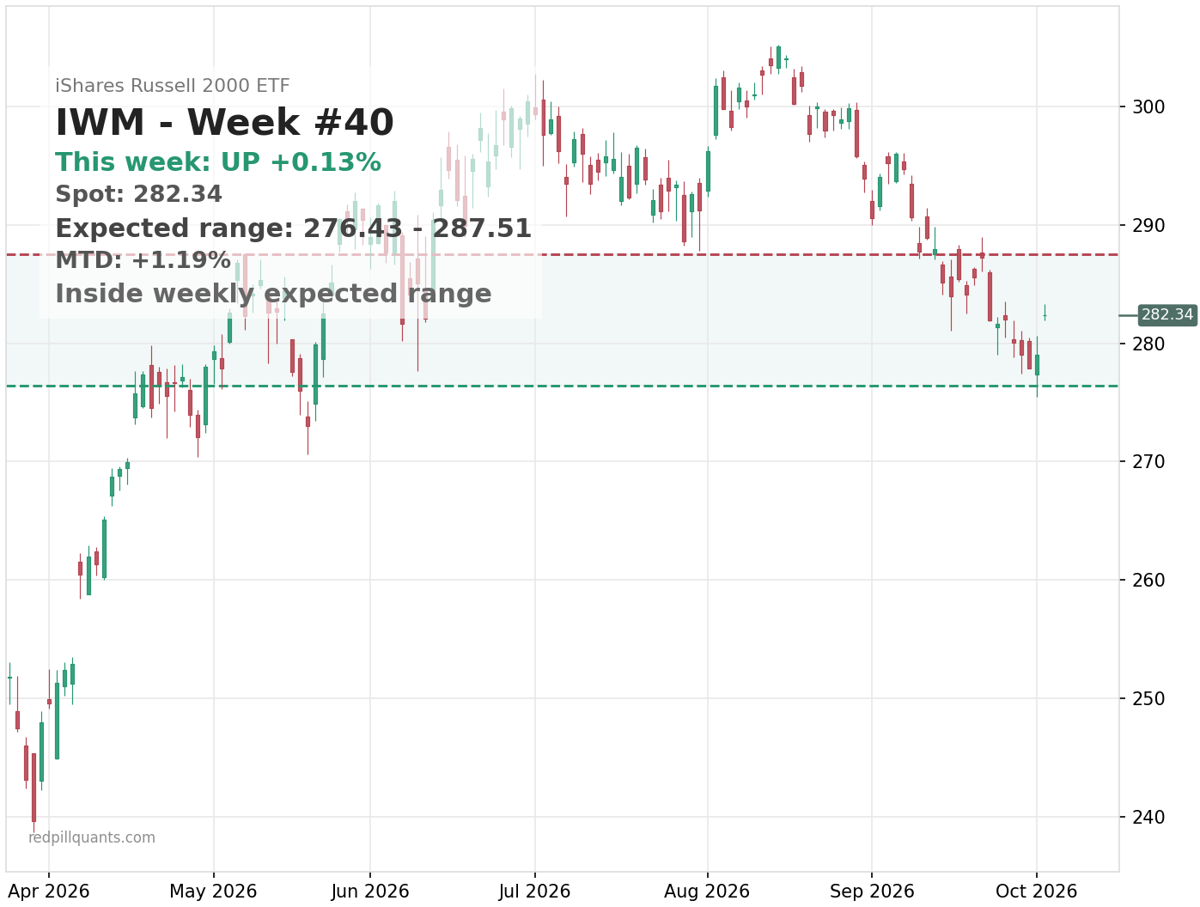
IWM has spent the last three weeks grinding lower, down about 4% over 20 days, sitting in the lower quartile of its three-month range. Yesterday’s session was modestly positive, and there are early signs of stabilization in small-caps and equal-weight indexes.
This is the kind of setup that gets called a “broadening” trade when it works and a “failed rotation” when it doesn’t. Wall Street has a name for everything, especially the things it can’t predict.
The structural problem is that IWM’s rollover has been running for 24 bars. One modestly green candle does not a comeback make. The weekly expected move on IWM is less than 2% of spot, which tells you the options market isn’t expecting fireworks in either direction. That’s range behavior, not reversal behavior.
The early stabilization may be real. But it needs a permission slip from somewhere specific: Treasury yields.
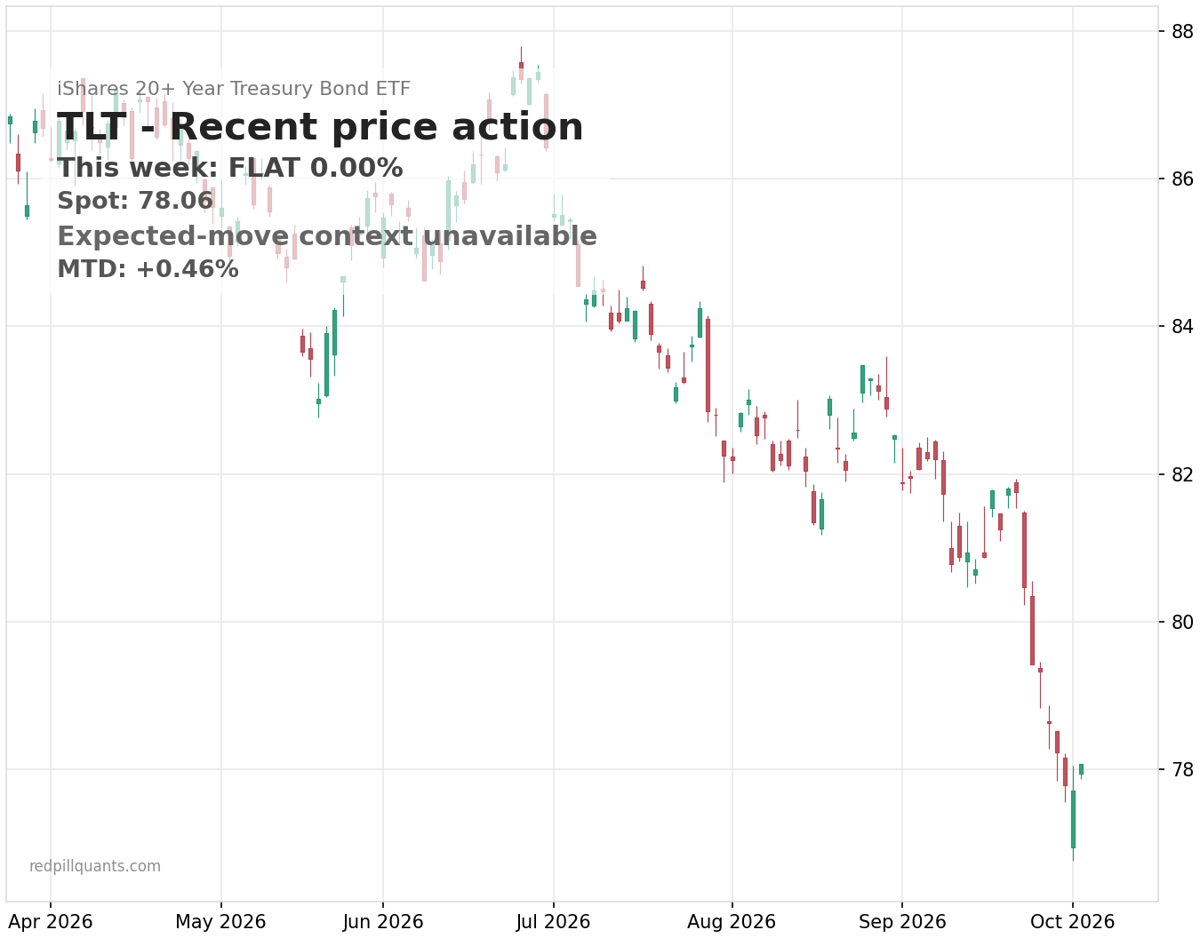
TLT has dropped nearly 4% over two weeks and is sitting just above its three-month low near $77. The trend structure is bearish. 22 bars of downside pressure, price below both trend signals. Today was a small bounce. The medium-term read is still deterioration.
Here’s why this matters: The two themes on the tape right now, the NVDA re-rating and the IWM stabilization, are connected at the hip through rates. If yields actually top out, it does two things at once: it expands the valuation multiple on long-duration growth names like Nvidia, and it relieves the pressure that has been slowly suffocating small-caps. Both trades need the same thing to happen in bonds.
That’s either a tidy setup or a concentrated risk. Depends entirely on whether yields cooperate. And yields, in my experience, don’t care about your feelings or your positioning. They do what the bond market tells them to do, and the bond market has been telling everyone to watch down below.
The honest read: tech is trending. Small-caps are trying to stabilize but haven’t proven anything yet. Bonds are still in a downtrend with a modest bounce that could mean something or could mean nothing. The broadening narrative is plausible. The evidence for it is early and conditional.
Calling it a “confirmed rotation” at this point would be getting ahead of the tape. And the tape has a long memory for that kind of optimism. Ask anyone who called the bottom in IWM three weeks ago how that worked out.
If the yield picture actually turns and TLT can reclaim some ground, the paired setup (long NVDA on the valuation reset, long IWM to capture a genuine broadening) gets structurally interesting. Right now it’s a hypothesis with two dependencies, not a clean signal. And in this business, the difference between a hypothesis and a signal is usually the memory of a loss.
This is the kind of structural work that drives SPY Alpha. Not predictions, not hot takes. Structure, trend state, and volatility context turned into entries you can actually trade. If that sounds like your kind of thing then sign up here.
Cheers,
Michael