


The easy part of the AI trade is over. Anybody can write a check for $200 billion. This week the three biggest names in the trade have to stand in front of the class and show what the money actually earned.
One of them is guiding to $195B-$205B of capex for 2026. Another is burning through more than $50B a quarter. That is not a rounding error, that is a mid-sized country’s GDP getting burned on GPU cycles.
So the gold rush is nearing its zenith and conversation has shifted. Nobody is asking “is AI demand real” anymore. That question has been answered. The litmus test now is whether the spend converts into revenue at margins that justify it. Free cash flow is the bar now, not headline growth. And if you believe the positioning, the market has already started grading in red ink.
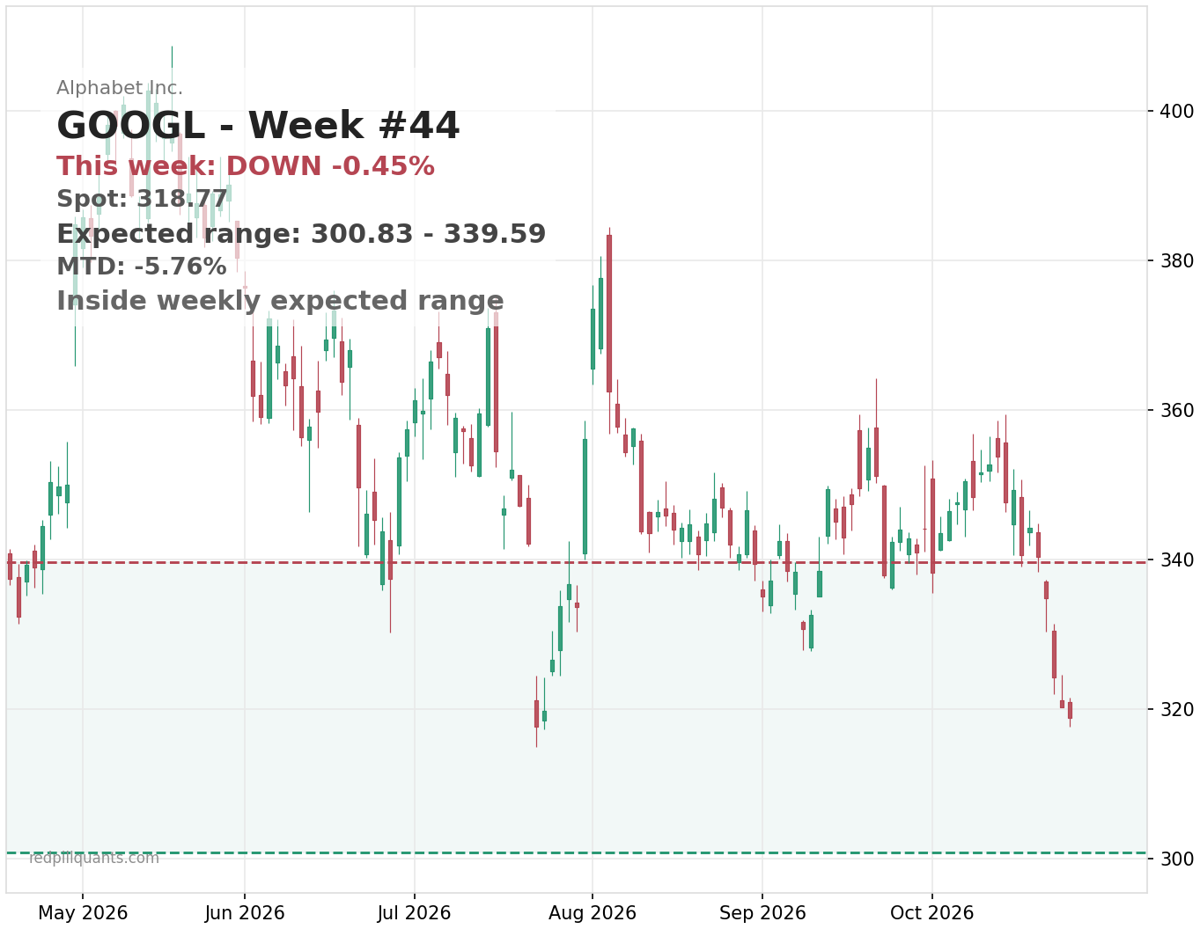
Alphabet is where the skepticism is loudest. GOOGL closed Friday near $321, about 1% above its three-month low and roughly 17% off the high. Cloud revenue grew 82% last quarter and free cash flow still briefly went negative. Read that twice. You can be the best salesman on the lot and still lose money on every car you move. That is the whole debate in one stock.
The weekly expected move runs about $301 to $340, a normal-width range. The options market is not pricing an outsized reaction into the print. That should bother the market more than it currently lets on. Normal width into a binary event smells increasingly like complacency in the face of a tornado warning.
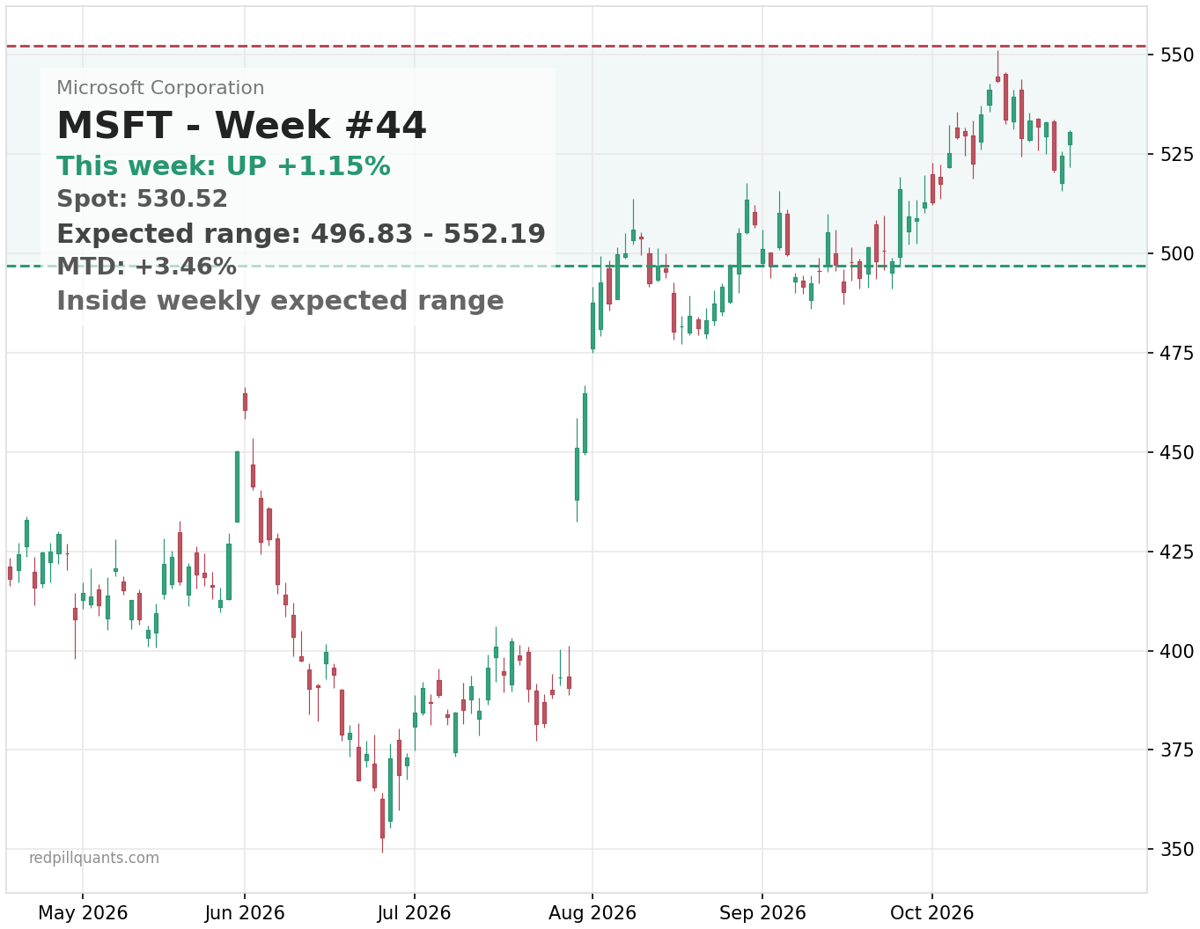
Microsoft is the one name still getting the benefit of the doubt. MSFT closed near $529, in the upper quartile of its three-month range, about 4% off the high, in a months-old uptrend. Same capex scrutiny, different verdict so far. Its expected move, roughly $497 to $552, is normal width as well.
Two names, same spending spree, and the market has already decided one of them is the responsible adult. But even the adult is required to report this week, so let’s see what happens.
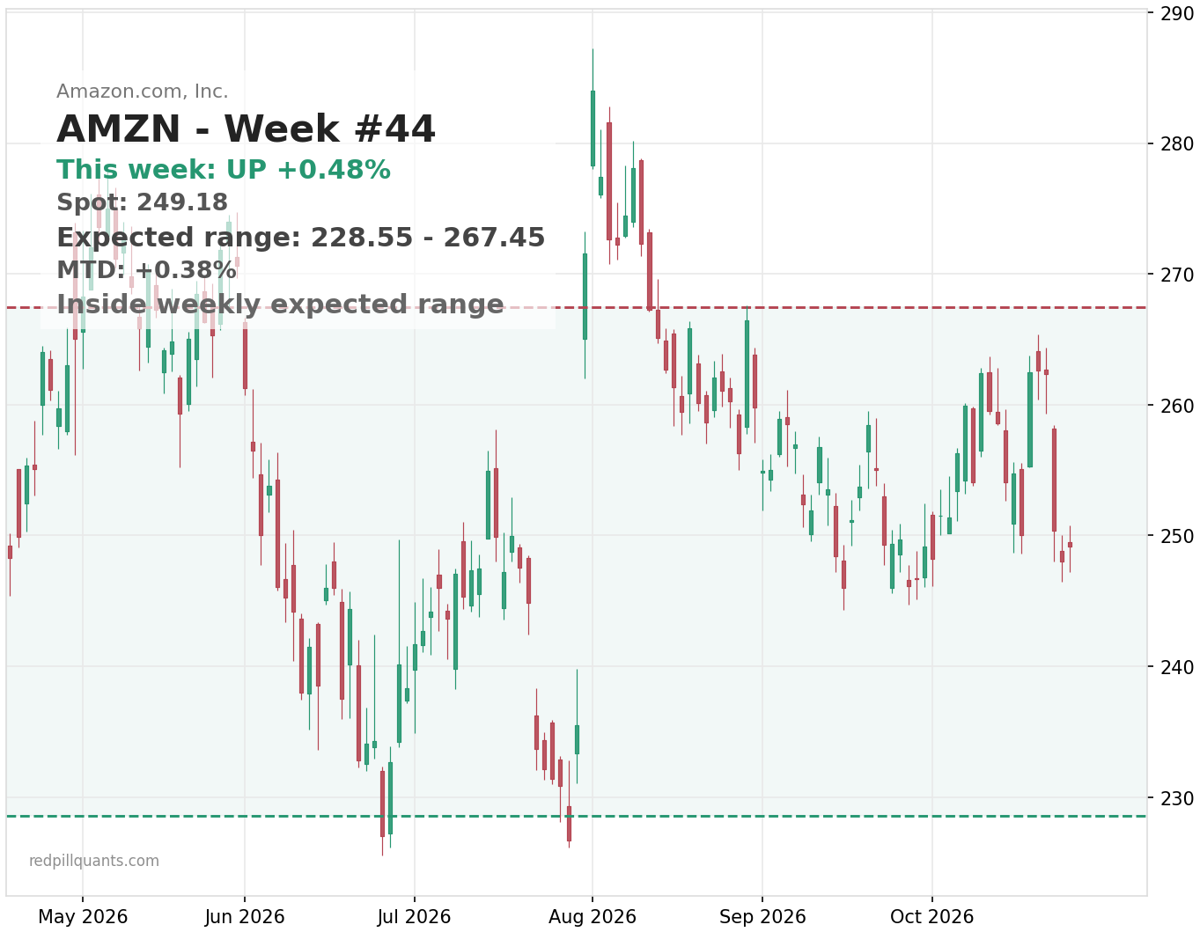
Amazon sits in between, and the options market knows it. AMZN closed near $250 in the lower half of its range, in what reads as a fresh bearish transition. The weekly expected move is wide, about 8% of spot. That is the market pricing a possible trainwreck, not business as usual.
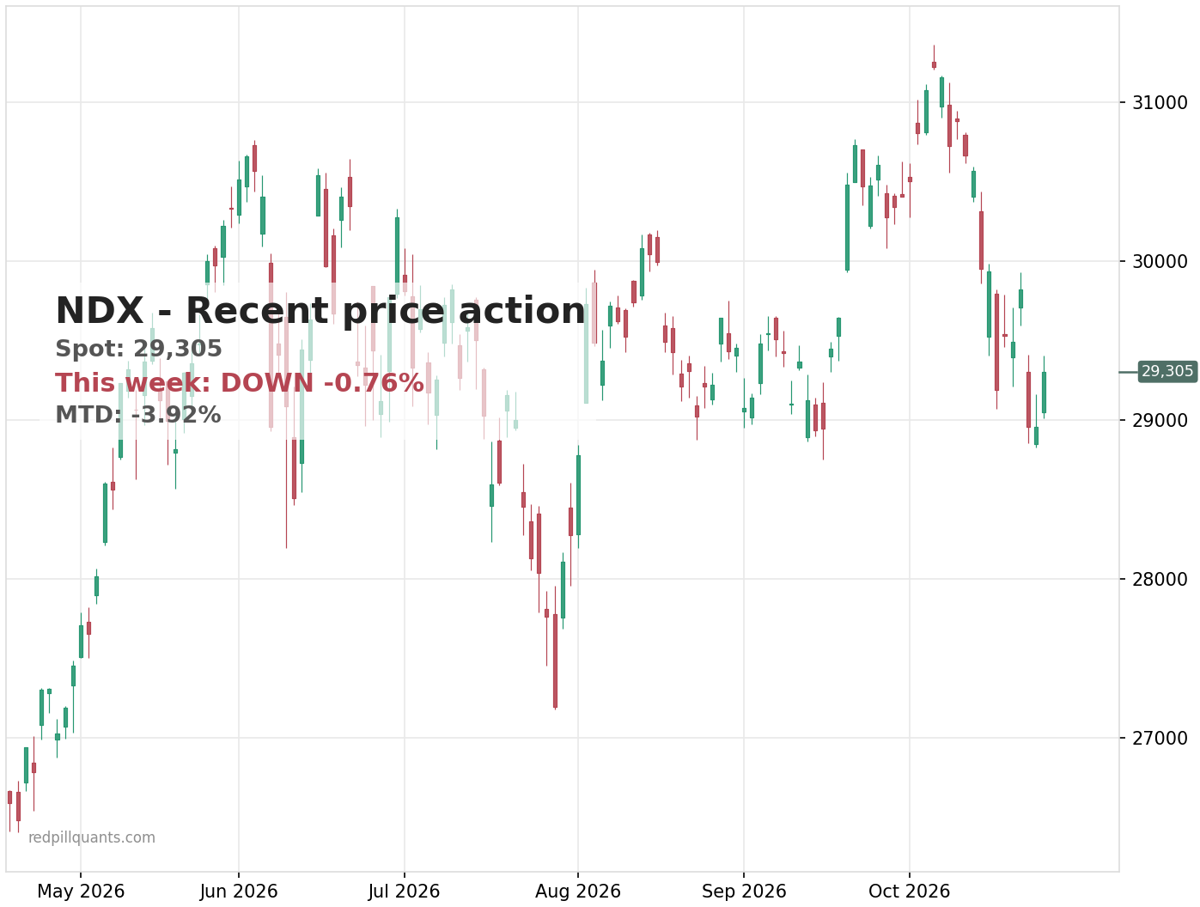
The index itself is mid-range. NDX bounced 1.4% Friday to close near 29,370, but it is still down about 0.5% on the week and 3.7% for the month, and the broader structure still reads as a rollover: price below its trend measures. One green day doesn’t retire the question. It just gives the bulls a screenshot to post.
Then there is Wednesday’s FOMC announcement – the hits just keep coming. Futures are pricing roughly a 90% chance the Fed holds, so the decision itself is probably not the event. The preceding expectation is.
Long-duration tech does not need a hike to get punished. It just needs the wrong message about inflation for the bear party to kick into high gear.
What are the systems doing into all this? SigmaScanner opened a new weekly cycle Friday with a mixed book: one bear call, one bull call, three bull puts. INTC was closed earlier today for a small profit as it’s got earnings scheduled going into Friday. In the future both Blitzer and Payday Friday will now be scanning the weekly earnings calendar in order to avoid high risk trades, particularly if credit spreads are involved.
Speaking of which, Blitzer is holding a Mastercard call debit spread and nothing in big tech. When the referendum is binary, watching the knife fight from a distance is what keeps you in the game.
So what resolves this? Not the beats. Watch free cash flow and margin commentary. If Alphabet shows Cloud growing at 82% while cash flow holds, the 17% discount starts looking like skepticism that ran ahead of itself.
If capex guidance climbs again while margins compress, the market has its answer, and GOOGL near the lows stops looking cheap and starts looking early. Those are two very different stocks wearing the same ticker, and the report card tells you which one you own.
If you want this kind of read, structure, expected move, what the tape is actually pricing, turned into live signals, that is what the Alpha streams do. SPY Alpha for equities and index options. Check it out here.
Cheers,
Michael