




Small caps are being punished by the cost of money while Tesla is being bid on a technical breakout level. IWM is near the bottom of its three-month range; TSLA closed Thursday just 18 cents below the level the breakout crowd is watching. That’s narrow leadership, not broad risk appetite.
The pressure on IWM is straightforward. 10-year yields near 5.2%, Brent back above $100, and consumer debt somewhere around $18.5 trillion. I can’t verify every one of those numbers from my desk, but the price action doesn’t need them to be exact. Small caps are the most rate-sensitive, debt-heavy corner of the equity market, and they’re trading like it.
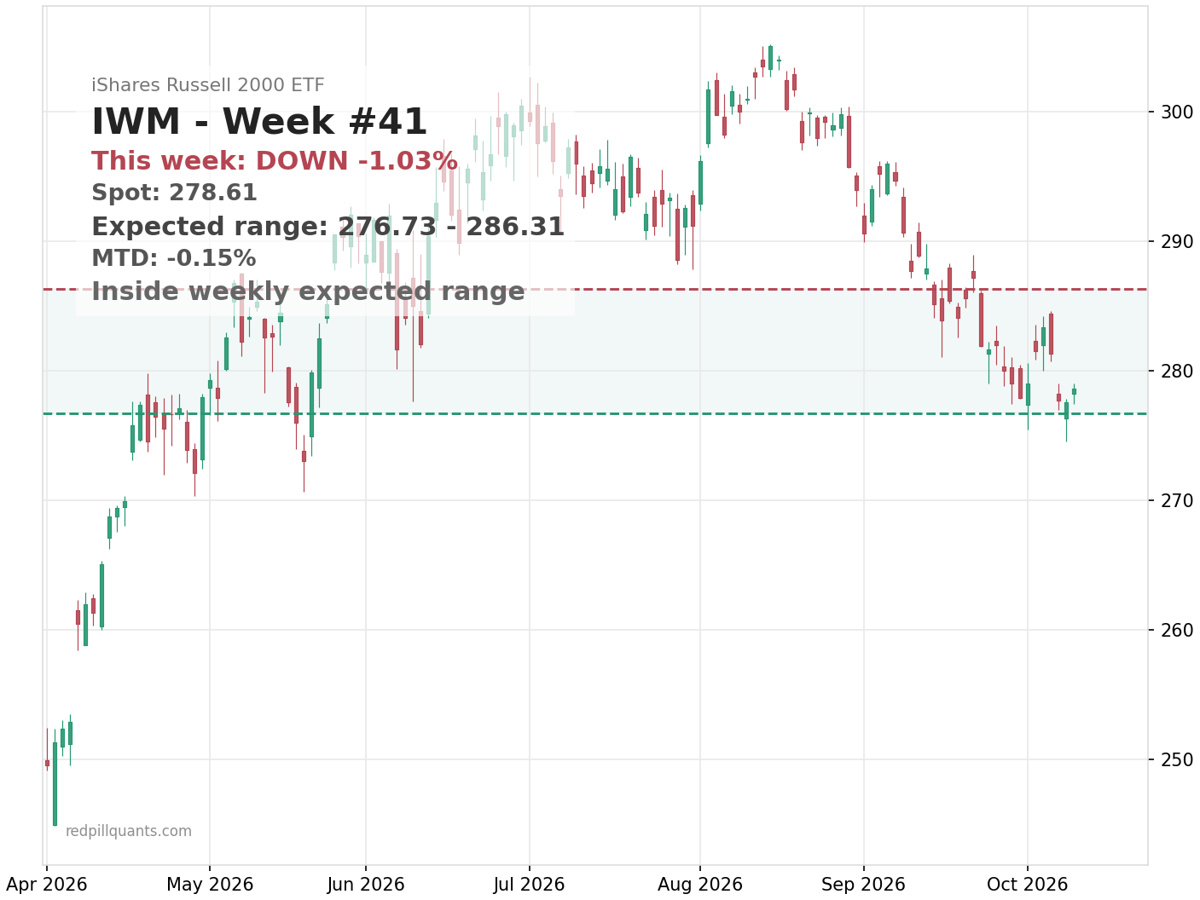
IWM is down about 1% on the week while SPY added 1%. Lower quartile of its three-month range. The slow trend measure is still sitting above the fast one, which means the downtrend that started weeks ago hasn’t released its grip.
The weekly expected move is only about 1.7%, roughly $277 to $286, so the market is pricing a quiet week. That’s not a bullish or bearish signal by itself. It means any breakout from this range needs to prove it can hold outside before it deserves more than tactical attention.
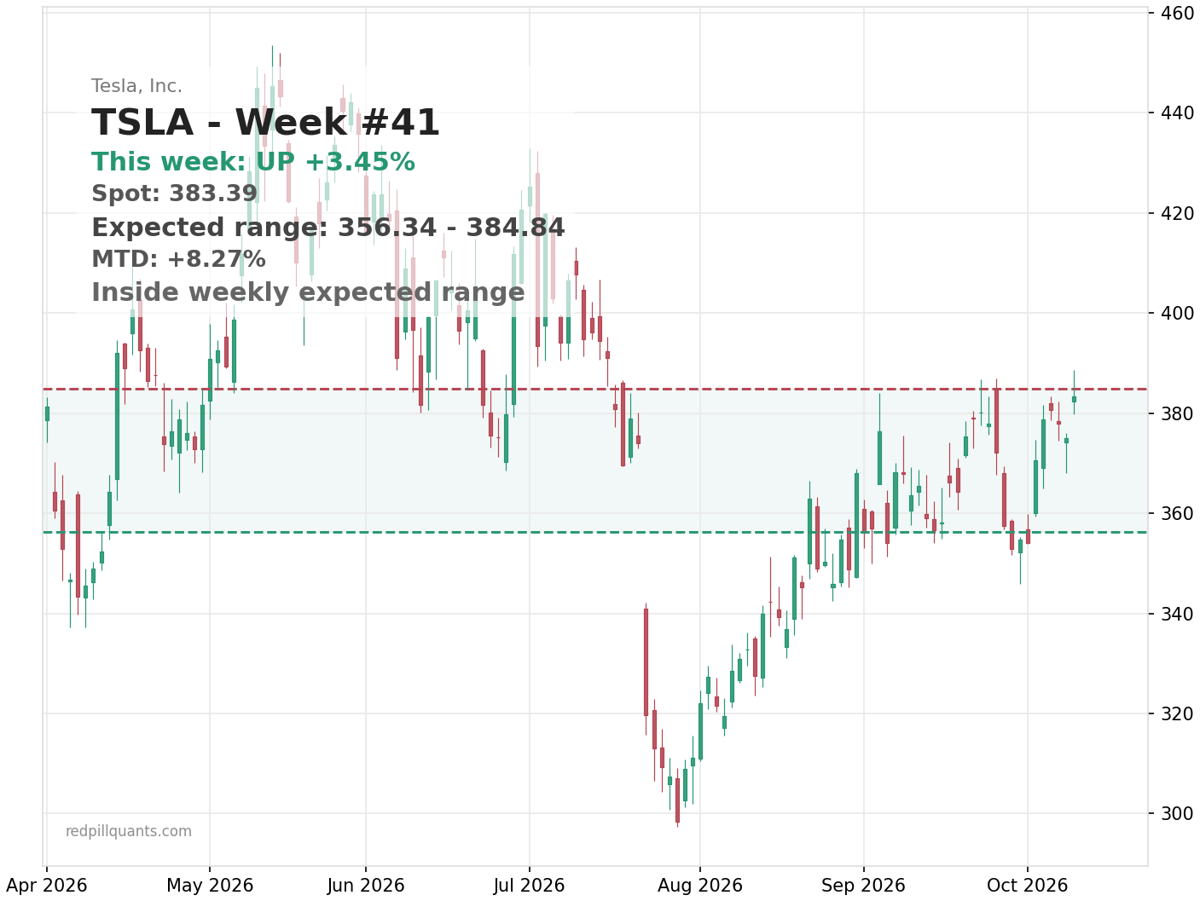
TSLA is the other side of this split. Up about 3.5% on the week, upper half of its three-month range, with a fresh bullish transition on my trend read. The fast measure crossed above the slow one four sessions ago. The level everyone’s circling is a daily close above $383.63, which supposedly opens the $397 to $401 zone.
Thursday’s close was $383.45. Eighteen cents short. A meaningful chunk of the trading public is already celebrating a breakout that hasn’t technically happened.
Even if the trigger fires, keep the frame straight. The long-term bearish case on TSLA is still active. It only comes off the table on a weekly close above $401. Which means the $397 to $401 zone is exactly where sellers are supposed to defend. This is a tactical bounce inside a larger downtrend, not a reversal. Treating it as one is how you end up holding the bag at $400 with a screenshot of the breakout.
Why does the split matter? Because this is what narrow leadership looks like from the inside. SPY up on the week, QQQ flat, the Russell bleeding, VIX under 15. The index-level calm is being held up by a handful of mega-caps trading their own charts while the rate-sensitive tail absorbs the tightening.
The uncomfortable scenario isn’t small caps sliding another 3%. It’s the AI capex thesis wobbling. The same mega-cap names holding the indices up would become the source of downside if that confidence cracks, and there’s no broad participation underneath to cushion it.
Practically: IWM’s tape still favors downside pressure. TSLA is a trigger trade. Either it closes above $383.63 and you know exactly what you’re trading, or it doesn’t and you’re just long hope with a chart attached.
If you want reads like this, trend state, expected move, and structure turned into actual entries and exits, that’s what SPY Alpha does for equities and index options. Sign up here.
Cheers,
Michael