




NVDA closed the week at $234, poking above the top of its weekly expected move near $232. Friday’s candle faded from the open and it still held above the rail. Meanwhile implied volatility is sitting under 30%, which is about as calm as this stock gets with an earnings report on the calendar.
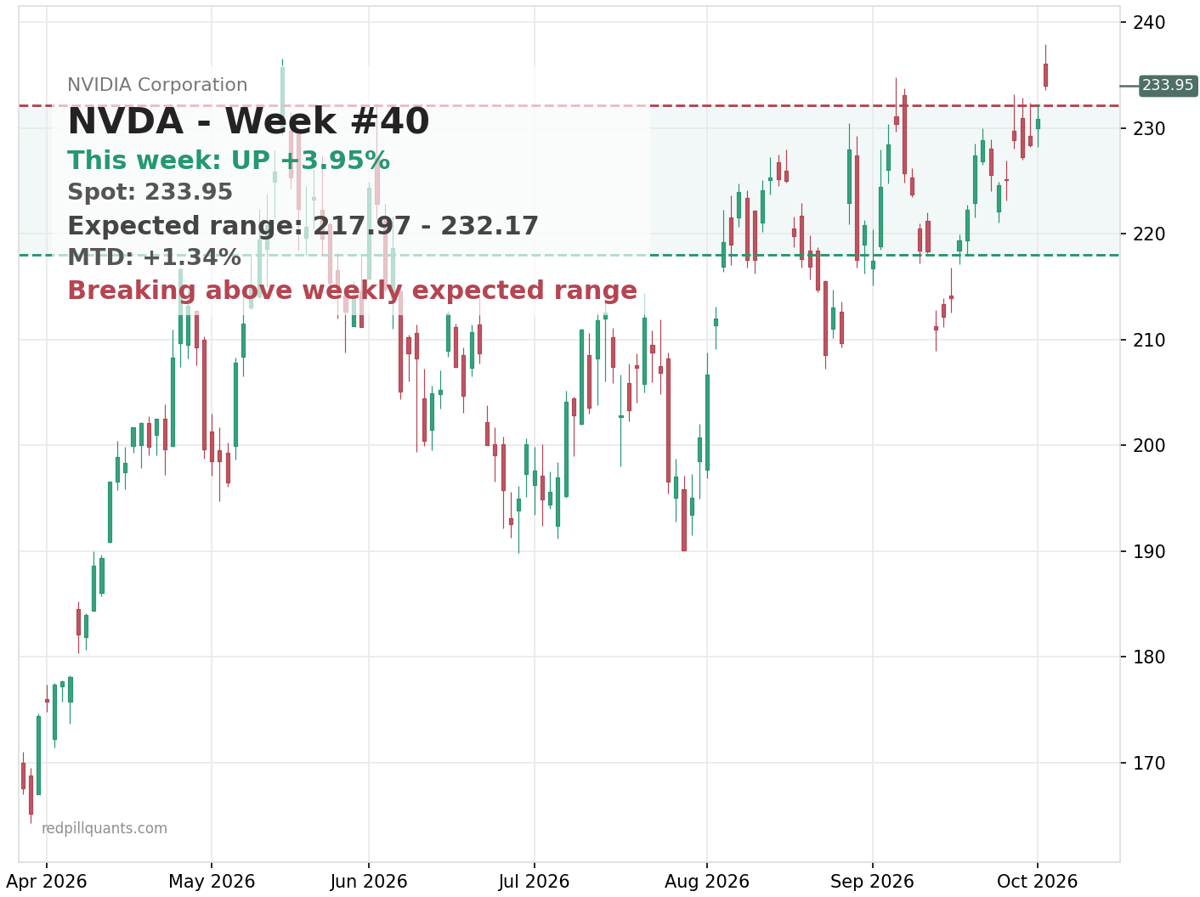
That report is reportedly November 18th, not officially confirmed yet. Either way, the options market is already telling you what it expects: a contained move, nothing dramatic. The weekly expected move is a narrow 3.2%.
When vol is that cheap into a known event, the interesting question isn’t direction. It’s whether the market is underpricing the event itself. If the date gets confirmed and IV stays this low, that’s a setup worth monitoring for volatility expansion. Not a trade I’m putting on today. A scenario I’m watching.
The broader tape is doing nothing to argue. SPY finished the week flat near $770, VIX slid to about 15, and the regime reads as range-and-pin. Earnings season kicks off in about a week, and right now nobody is paying up for protection.
Then there’s AMZN, the AI stock the market keeps leaving off the invitation list. It’s sitting near $251, about 12% below its recent high around $287, and my trend filter still has it pointed down. This week was a repair job, not a reversal.
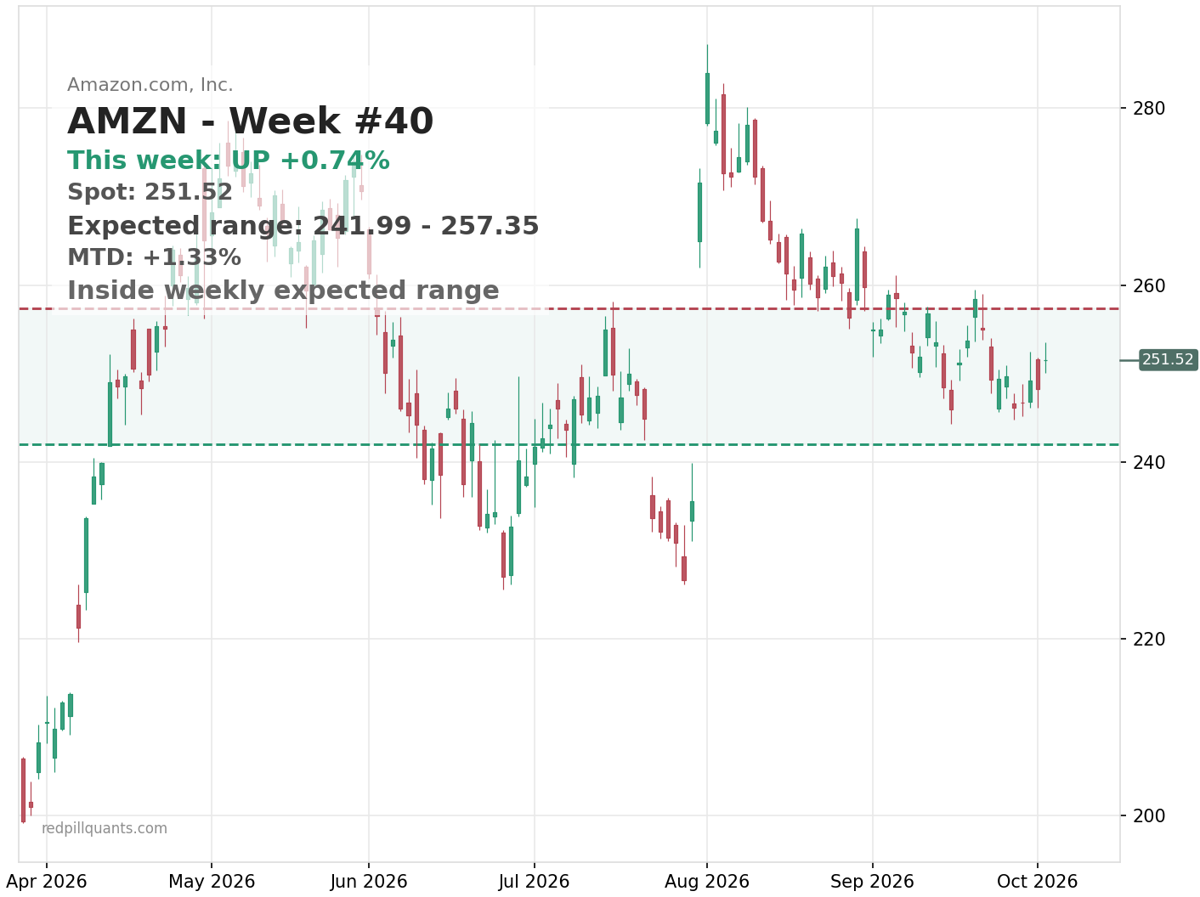
The strange part is the fundamentals aren’t obviously the problem. Reported net income growth has been strong, yet the stock trades like the market is more worried about the AI spending bill than the AI revenue. That’s a pricing decision, not a broken company, and it may stay that way until the October 29th report settles the argument.
AMD is the one name where the hype and the tape actually agree. Up about 39% in a month, closing near $634 just under its highs, and its weekly expected move around 5.5% is the only one of the four pricing real movement.
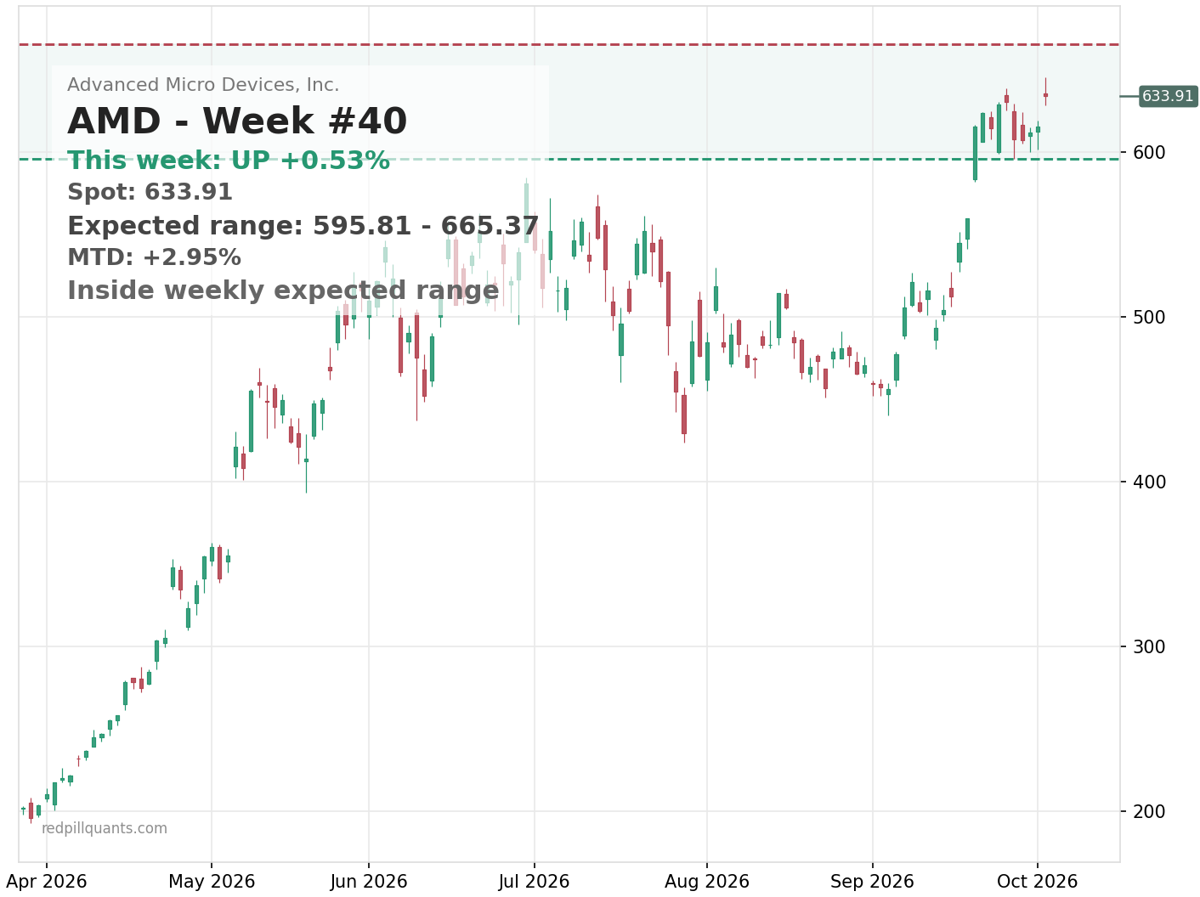
One caution before anyone screenshots a breakout: some of the loudest AMD chatter this weekend turned out to be about a video game port, not the stock. The move is real. A chunk of the confirmation floating around is not, and I haven’t seen volume data that settles it either way.
META rounds out the group. Up 19% in a month but down 3% this week, still sitting inside a narrow expected move near $728. That’s momentum cooling, not breaking.
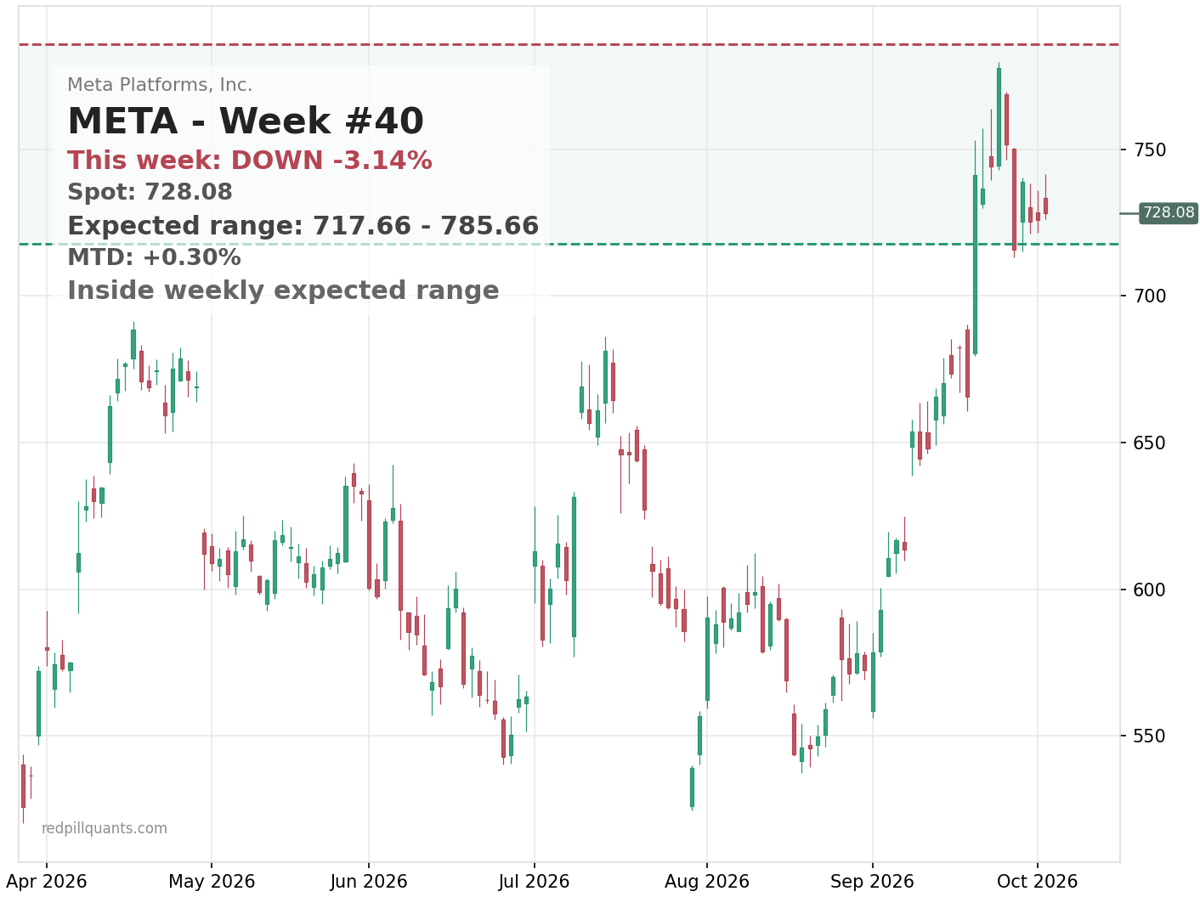
Step back and the four biggest AI names are being priced four different ways. NVDA at highs with sleepy vol, AMZN in a downtrend with a credibility problem, AMD running hot with real range, META digesting.
“AI momentum” as a single trade does not exist right now, whatever the headlines say. The mistake this tape invites is letting a loud narrative do your thinking for you.
What actually matters over the next few weeks: confirmed earnings dates, and whether implied vol stays this cheap into them. Everything else is decoration.
If you want this kind of structural read turned into live signals on equities and index options, that’s what SPY Alpha does. Take a look here.
Cheers,
Michael