



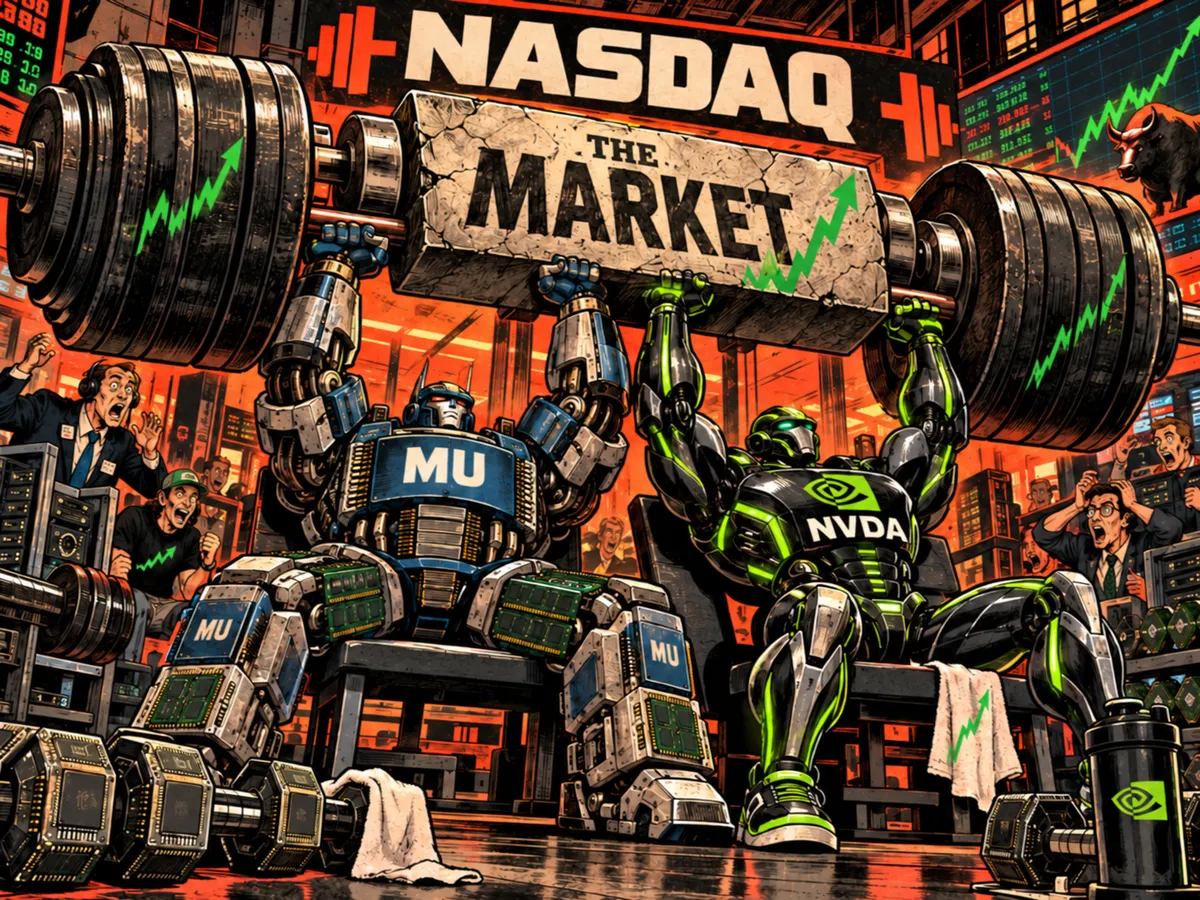
How many stocks does it take to hold up an index? Right now the honest answer is: not many, and two of the most important ones report this week.
NVDA goes Wednesday, with MU’s outlook in the same window, and the question isn’t whether the headline numbers beat. It’s whether the forward AI demand story is strong enough to pull the rest of the market into a rally it has mostly refused to join.
Start with NVDA. The stock gave back about 2% last week and Friday’s candle faded from the open, which is a polite way of saying buyers aren’t defending strength the way they were.
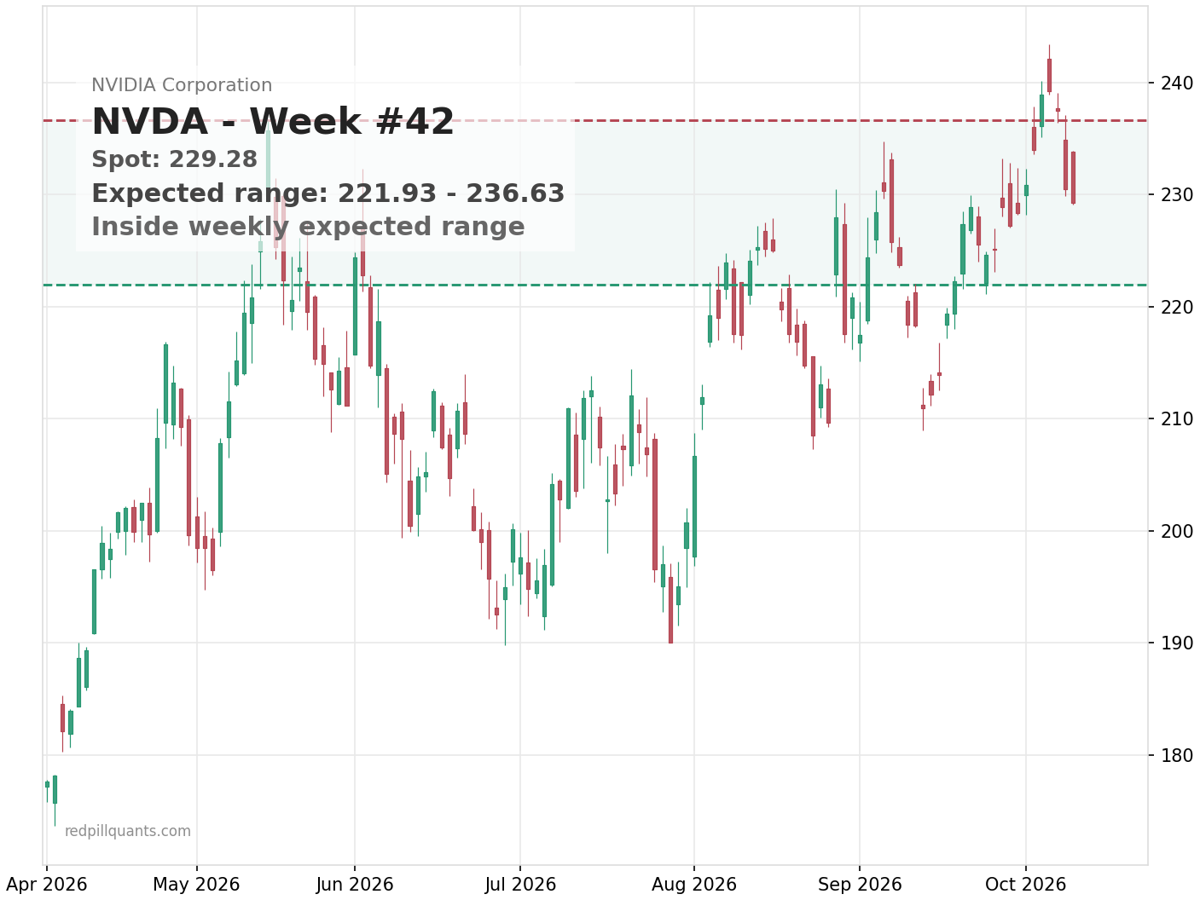 The medium-term uptrend is still intact, and price sits inside a narrow weekly expected move of roughly 3.2% – call it $222 to $237. The print itself is almost beside the point. What moves the stock is what management says about demand into next year.
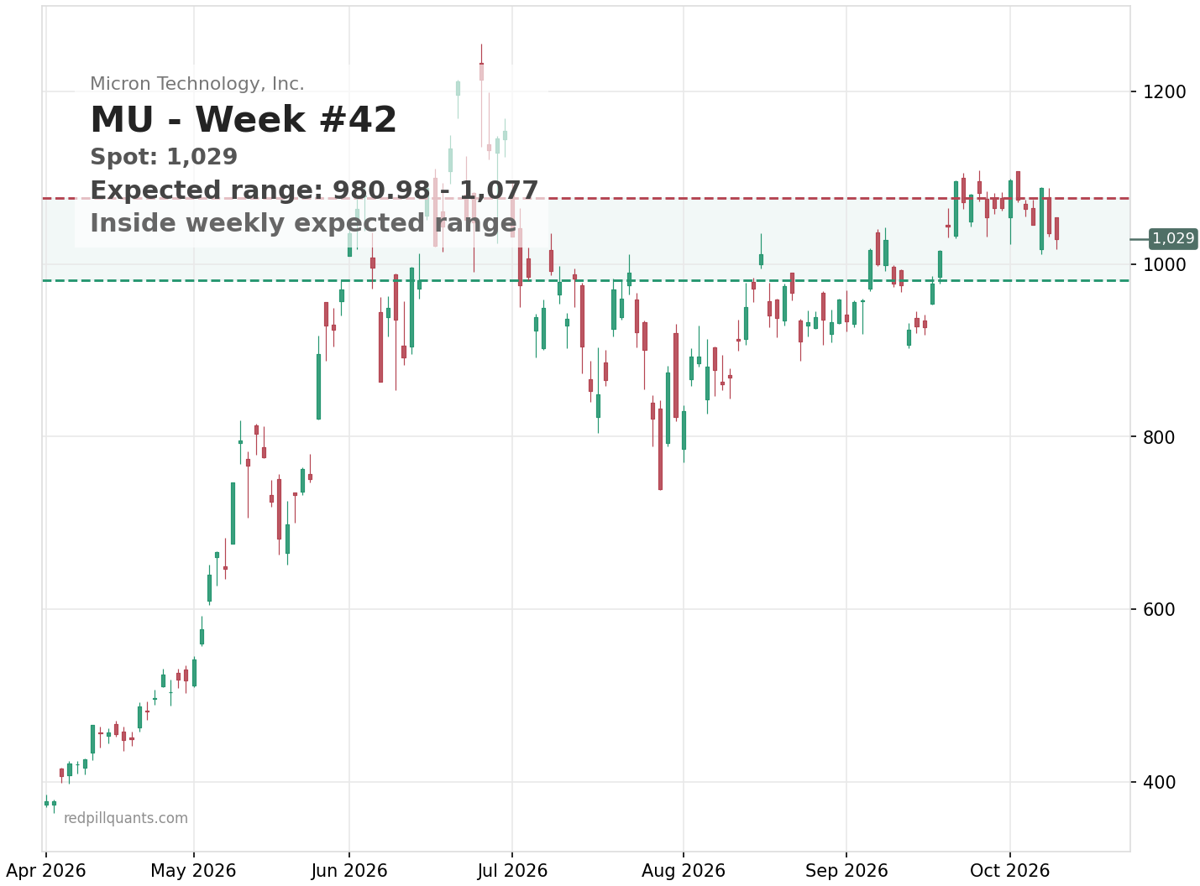
MU is the more interesting tell. It’s down about 4% on the week, closed at $1029, and has slipped below its 20-day average – despite still sitting nearly 40% above its summer low. The risk here isn’t a miss on the quarter. It’s any hint from management that AI memory demand has a shelf life. A stock that’s run this hard doesn’t need bad news to wobble. It needs one good reason to stop.
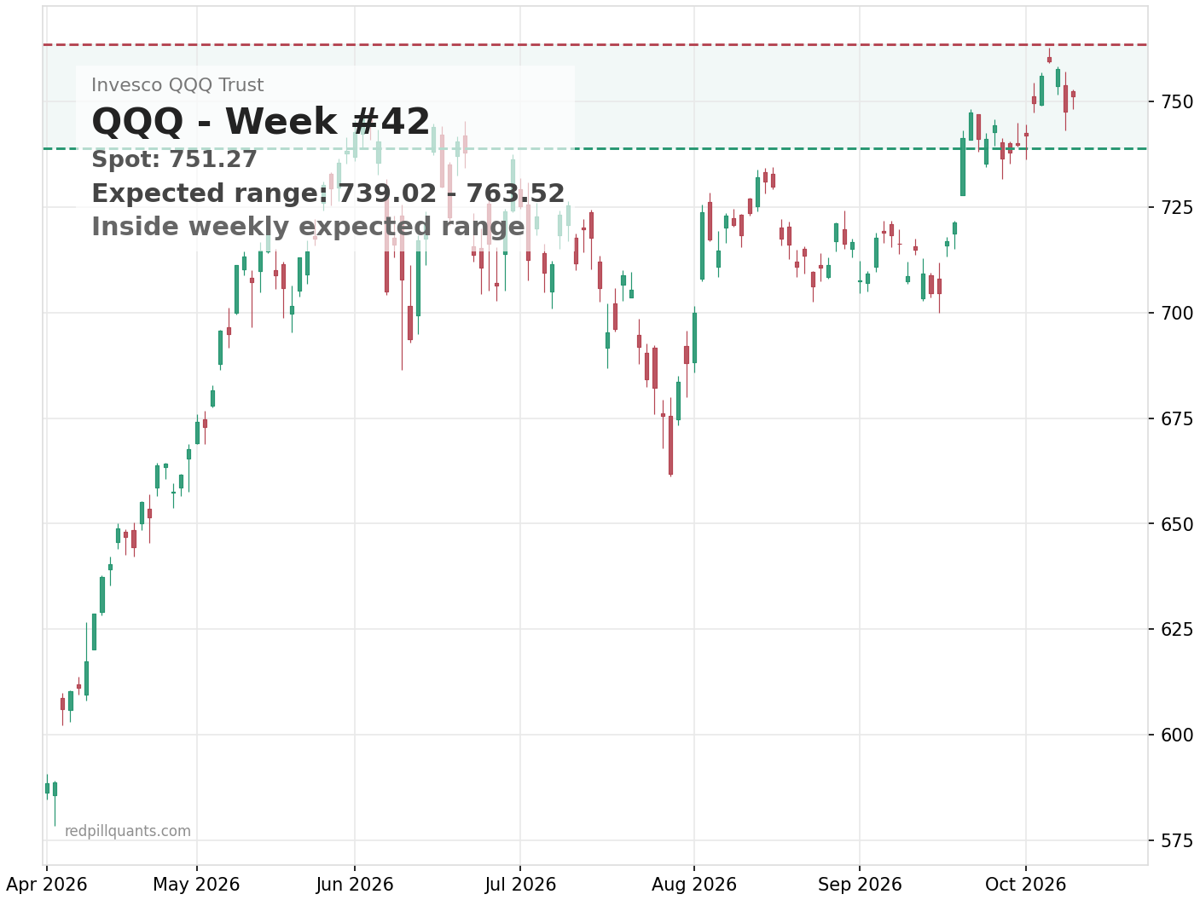
Now look at what these two names are holding up. QQQ closed Friday at $751.27, about 1.5% off its three-month high, with a very narrow weekly expected move of roughly 1.6%. The trend is fine. The breadth underneath it is not – strip out the mega-cap weight and most of the index is going sideways or lower.
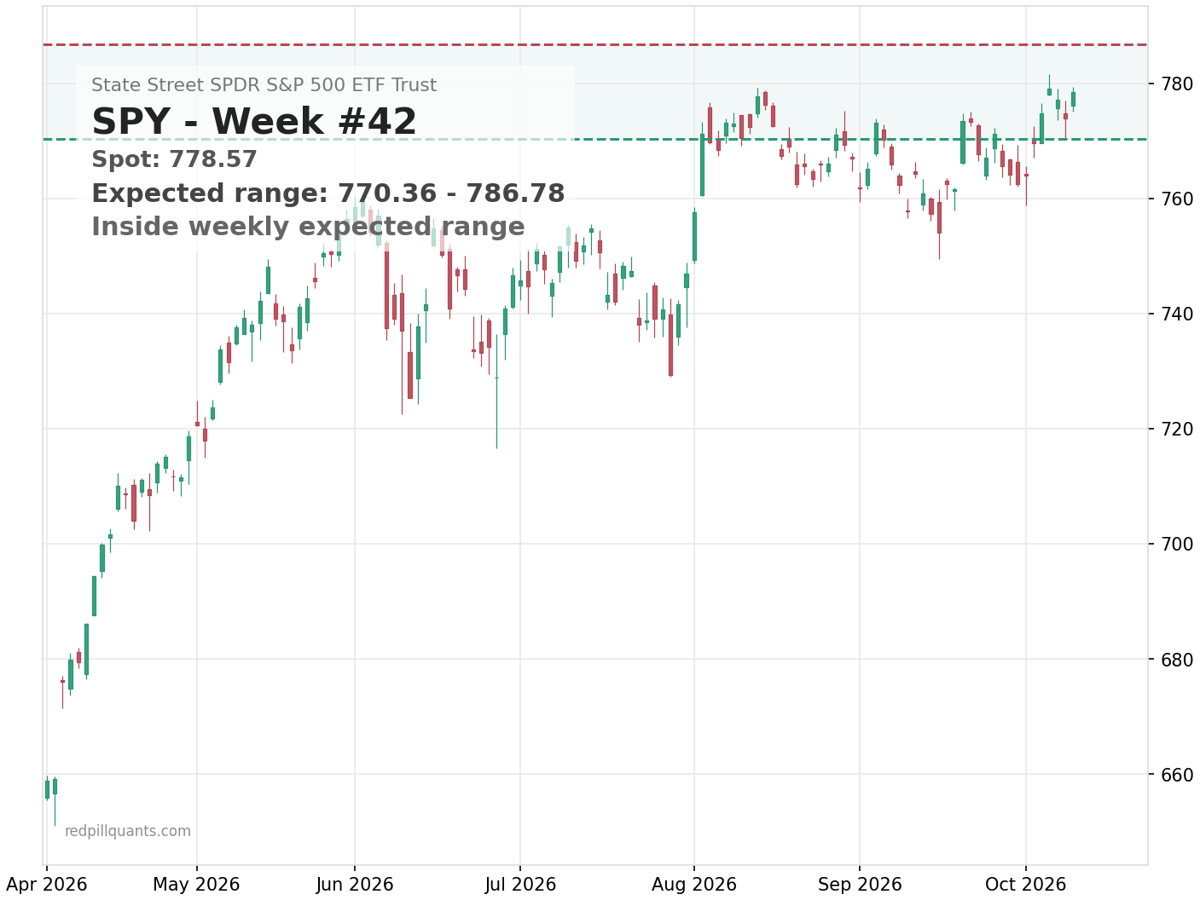
SPY tells the same story at $778.57, less than half a percent below its own high, with an expected move of about 1% on the week. Meanwhile small caps lost ground over the same stretch and most sectors are spectators. The index is near a high because of how cap-weighting works: a few names do the lifting while the rest hold the coats.
The backdrop isn’t exactly instilling confidence among skeptics. Yields are rising and rate expectations are becoming less friendly. Semis have been lagging software, and the chip complex is the thing being tested here, not the proof. Worth noting the VIX ticked up to about 15.5 on Friday. Nobody’s panicking, but somebody’s buying insurance.
So what would settle it? The bullish scenario: NVDA and MU guide to sustained AI compute and memory demand, the laggards catch a bid, and breadth finally widens behind the highs. The bearish scenario: guidance disappoints and the market finds out, in real time, exactly how few stocks were doing the work.
On the tape, I’d watch MU reclaiming its short-term trend around the $1050 area, and NVDA holding the lower rail of its expected move near $222. If NVDA loses $222 on weak guidance, the index math gets ugly in a hurry – not because NVDA breaks, but because there’s no one behind it.
One more thing worth keeping in mind. Narrow leadership is a risk, not a verdict. Cap-weighted indexes have run on a handful of names before – sometimes for quarters, sometimes longer – and calling the top of that trade has been a reliable way to miss the move.
In the end you trade the market in front of you, not the one you want, or the one that’s supposed to be happening.
If you want this kind of read – structure, trend state, expected move – turned into live signals instead of homework, that’s what SPY Alpha does for equities and index options. You can check it out here.
Cheers,
Michael