




There’s a trendline on Bitcoin that has held since 2018, with one clean exception.
Price is sitting on it right now, and the only question that matters is whether this is where patient money builds a position or where late longs get harvested before a deeper flush. Here’s the state of the tape and the levels that settle it.
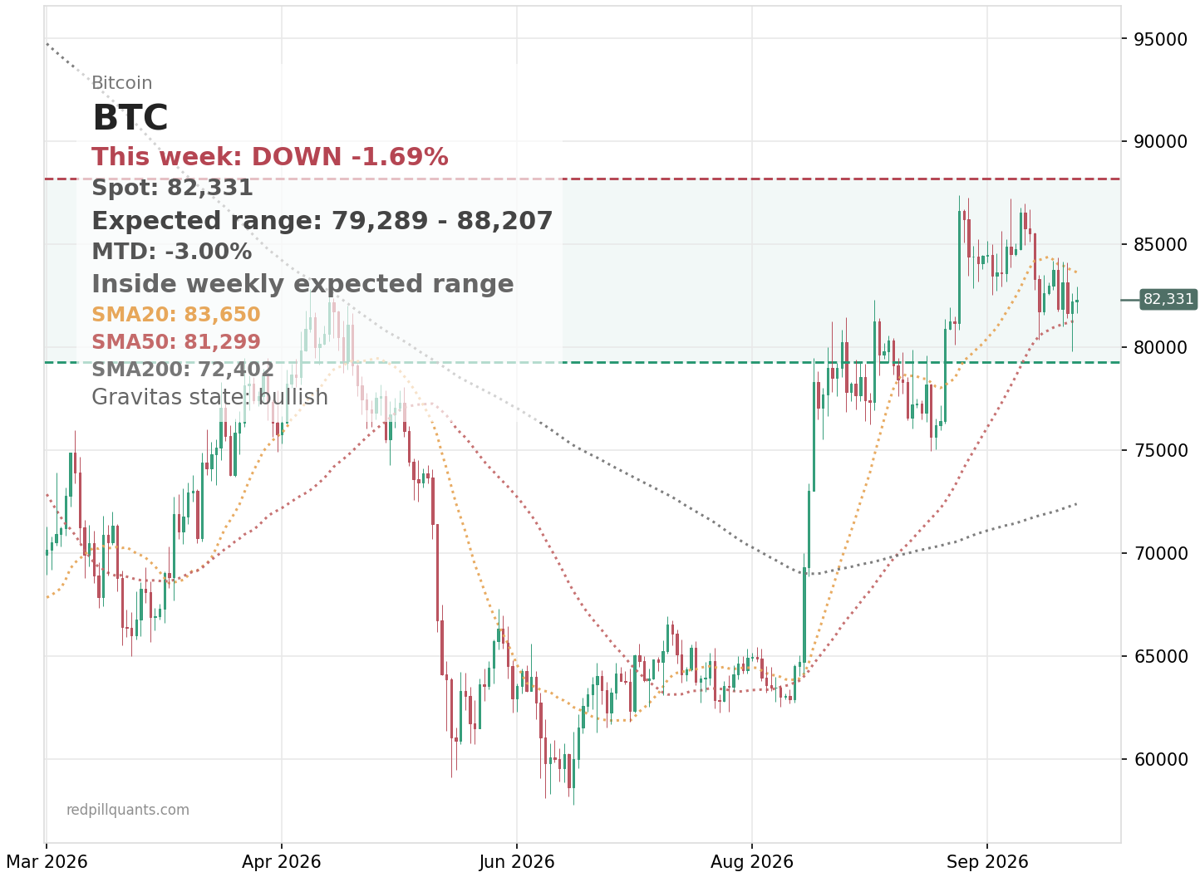
BTC is trading near $82.6k, up about 0.6% today but down roughly 1.3% over the past five days. It sits below its 20-day average near $83.7k, above the 50-day around $81.3k, and well above the 200-day. The trendline itself runs through the $80.4k-$82k zone, and price briefly broke below it before coming back.
The month and the week are telling different stories. BTC is up about 8% over 30 days while losing ground over the last five. Long-term structure says the trend is intact. Short-term momentum says nobody has confirmed anything yet.
Three reads are on the table. The accumulation case: this line has marked major turning points before, and holding it again fits the pattern. The trap case: a down week below the 20-day looks more like distribution than accumulation, and a retest is exactly where late longs provide exit liquidity for whoever’s distributing.
The third read is simpler – the institutional bid hasn’t shown up. ETF flows have stayed cautious even as the technical optimism builds, which leaves the market in confirmation limbo until a level resolves it.
One thing worth noting about the bulls’ favorite precedent: the line’s one clean failure was March 2020, and the famous rally came after the breakdown, not instead of it.
Even the best historical analogy involved the support failing first. Treating a trendline as a floor because it’s old isn’t analysis – it’s nostalgia with a ruler.
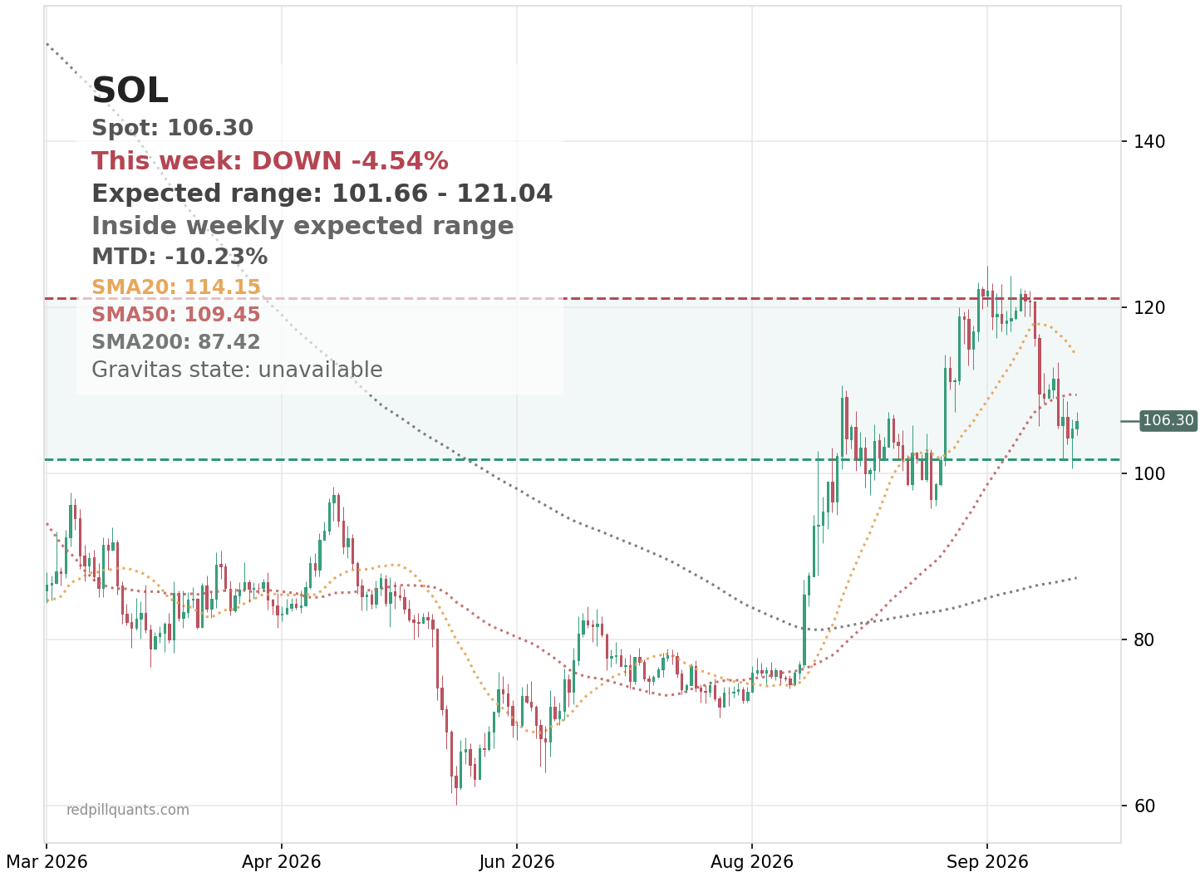
Solana’s version of the same tension is a monthly triangle. Price is near $107, down 4.2% on the week but up about 8% on the month, below both its 20-day near $114 and its 50-day near $109, and well above the 200-day.
The triangle is a setup, not a signal: it needs a weekly close above $115 to confirm, and the invalidation zone sits down at $76-$78. The only sane way to play a pattern like this is to make the market prove the breakout before it gets your full position.
What settles it for BTC: hold the $80.4k zone and reclaim the 20-day near $83.7k, and the accumulation case gets real. Lose the trendline on a weekly close and the trap case is live. Above that, $88k is where the trap case dies.
For SOL, it’s the weekly close above $115 or nothing. Everything in between is the market making you wait.
Crypto Alpha watches these levels on BTC and ETH around the clock, so your conviction doesn’t have to. You can check it out here.
Cheers,
Michael