




I know exactly what you’re doing right now. It’s football season Sunday. Trading volume is thinner than a gas station hot dog, and somewhere between your third beer and a doom-scroll, you decided Bitcoin looks promising at $82k.
 You’re about to pull the financial equivalent of texting your ex at 1am because you’re lonely and it seems like a good idea. You’re thinking about buying the dip. You’re thinking about calling the bottom. You’re thinking about being the hero.
Stop. Put the mouse or your phone down. You don’t have a thesis. You have a hangover.
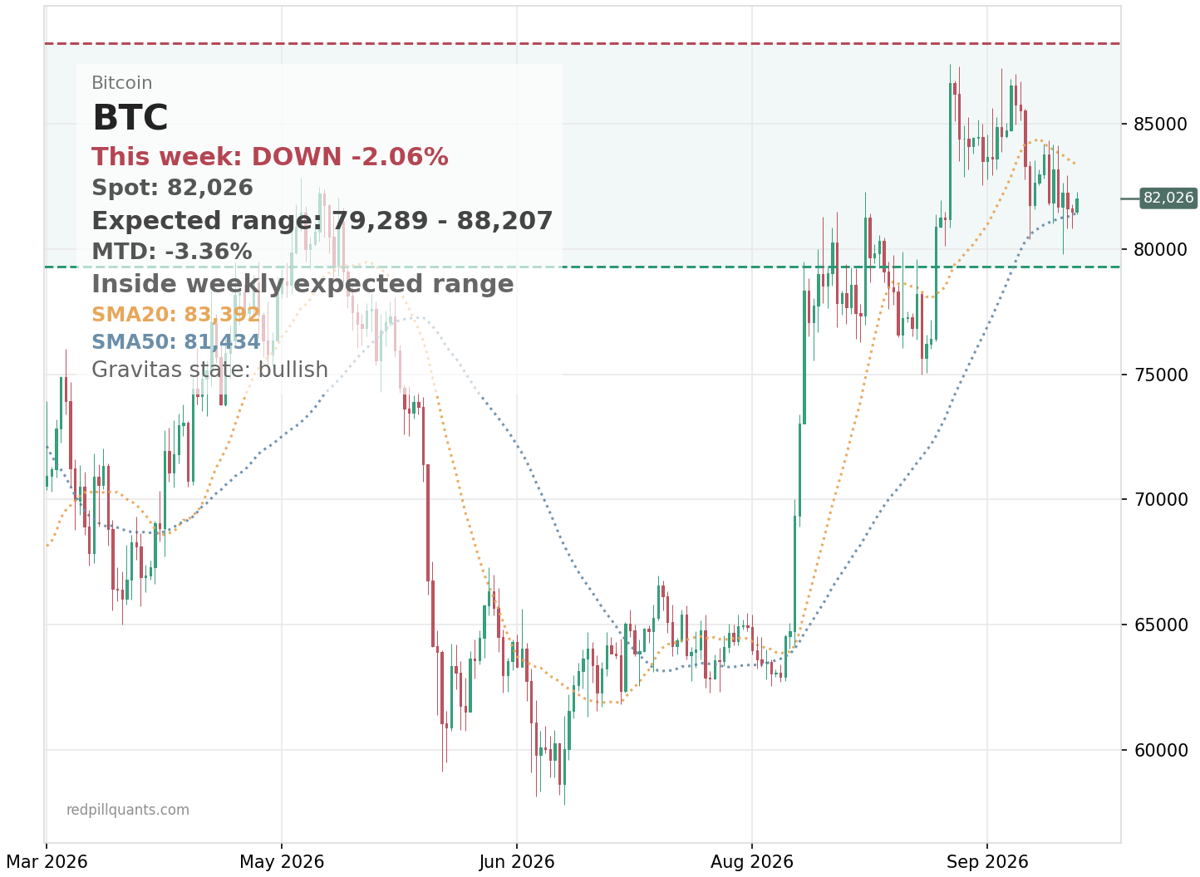
Let’s look at the tape. QQQ just got mugged down 5.5% in a week, and the VIX screamed up 21% in a single day like it walked in on its ex dating a day trader. And BTC? BTC is sitting there at $82,000, down 1.4% on the week, roughly flat over 30 days, looking like a houseplant that survived a week in a dark office. It’s not strength. It’s just… kind of there.
The chart is a shrug. Price is wedged between the orange 20-day line above and the blue 50-day line below. Resistance at $82,600. Support at $80,800. Call it a market holding its breath. Nobody can tell if it’s relaxed or about to pass out.
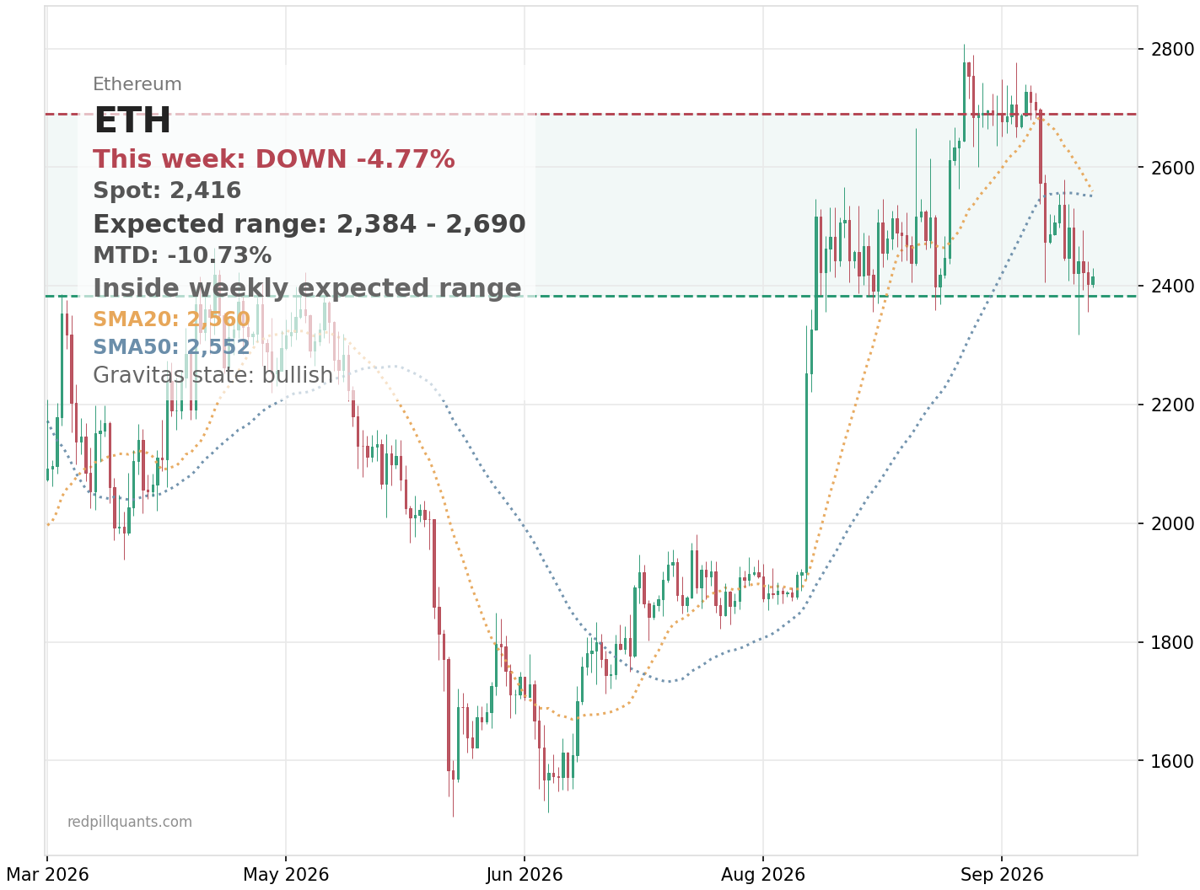 Ethereum isn’t even bothering to pretend. It’s at $2,415, below both of those trend lines, down about 8% on the month. The zone everyone’s staring at is $2,315 to $2,360. If that gives way, the consolidation story ends and the lower-low story starts. Not a prediction. Just a road map of where the story changes.
So why the split? Three stories are floating around, and the tape hasn’t told us which one has teeth yet.
First: ETF outflows. Roughly $320 million out of Ethereum products. It’s a reported number, not a settled fact, and it’s definitely not proof that institutions packed up and went home. Outflows happen inside uptrends all the time.
Second: it’s the weekend. Order flow is thin. Thin tape exaggerates everything. ETH’s weakness and BTC’s inability to clear $82,600 might both be low-participation artifacts rather than conviction.
Third: rotation. Money leaving ETH for BTC. Plausible, but correlational. Two assets moving differently is not evidence that one is funding the other. That’s like assuming your roommate pays your rent because you’re both broke in different ways.
Here’s the mistake this tape is practically begging you to make: picking a side early. Weekend crypto has a long, embarrassing history of looking decisive on Saturday and reversing by Tuesday’s open.
Don’t be the guy who calls the bottom on a Sunday or doubles down on a short without the tape providing new instructions. The market has a black belt in making people with opinions eat their own words.
So the read stays conditional. A BTC close above $82,600 with real weekday volume behind it would mean the stability is genuine. An ETH break below $2,315 would say the outflow story has teeth, and that’s your signal to trim alt exposure – not average down into it like you’re collecting baseball cards. Until one of those happens, the honest position is a watchlist, not a trade.
If you’d rather have a system watch the paint dry so you don’t have to, that’s exactly what Crypto Alpha does for BTC and ETH. You can check it out here.
Cheers,
Michael