




AMD just reported the biggest quarter in its history. Data center revenue nearly doubled. And…. the stock is down more than 20% in a month.
That gap between the quarter and the chart is the whole story in tech right now. Either this selloff is a political hangover that clears once the midterm dust settles, or the market is repricing AI capex itself, in which case “cheap” semis are a trap, not a gift.
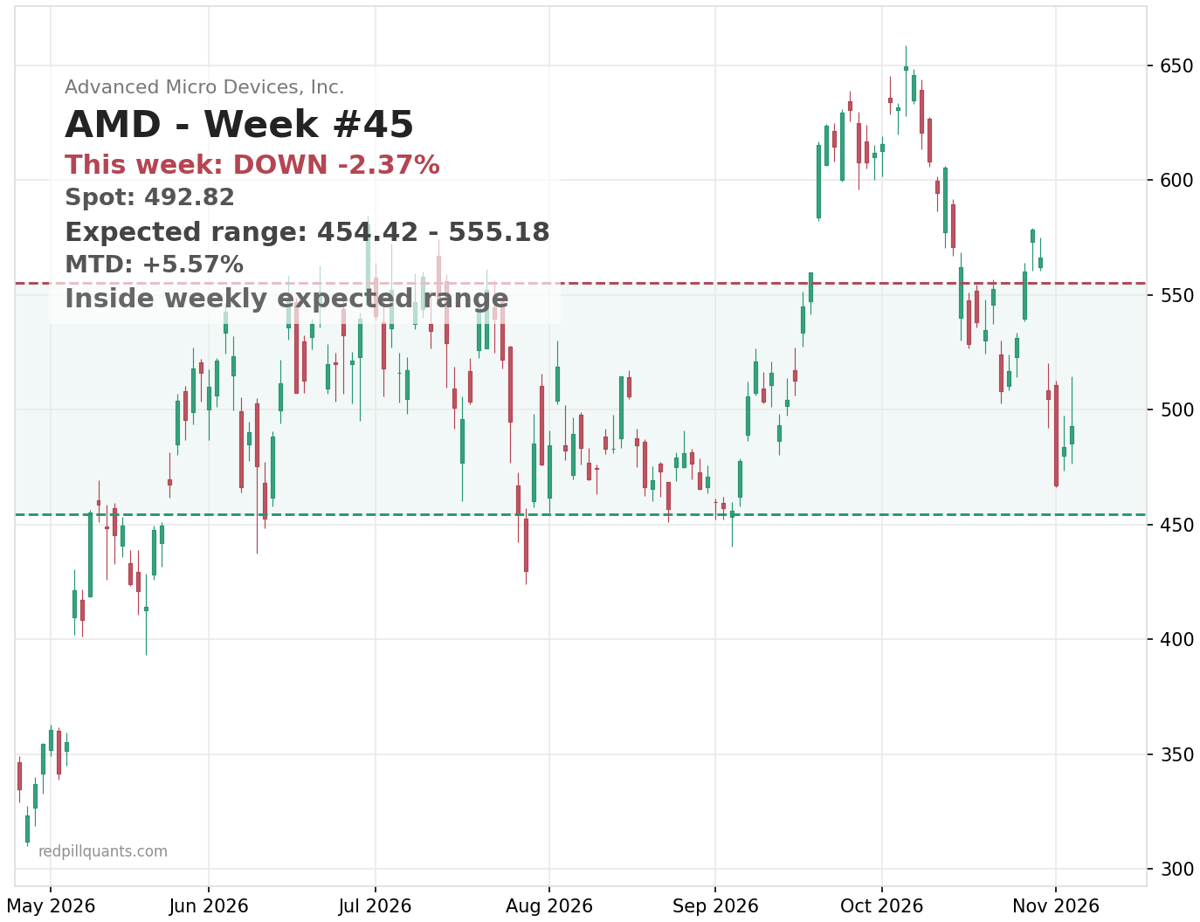 AMD closed near $493, sitting in the lower quartile of its 3-month range and below both the orange 20-day SMA and the blue 50-day SMA. The weekly expected move runs from roughly $454 to $555, a 10% range, which is wide even for a stock that just reported. One decent session inside a damaged downtrend is not a reversal.
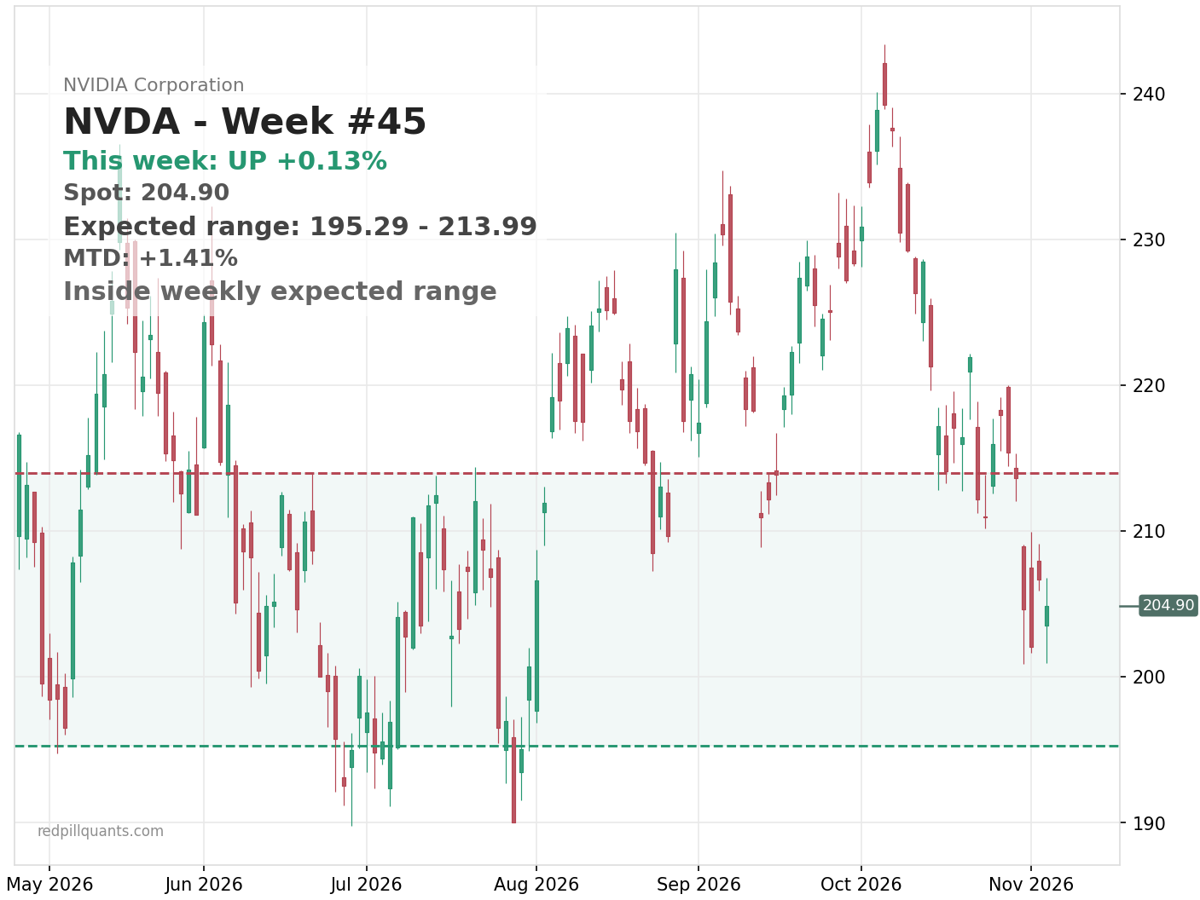
This is not an AMD problem. NVDA is parked near 3-month lows around $205, and Goldman Sachs is warning that capex anxiety is compressing the whole semiconductor complex, with NVDA’s forward multiple reportedly at its lowest since 2013. SPY is roughly flat over the same stretch. When the sector leader gets repriced while the index yawns, the sympathy bid in everything else disappears.
 AMD implied volatility is running near 135% against roughly 65% realized. Traders are paying up for a big move, and that premium says movement, not direction. What they are not doing is buying the stock on a record quarter. The marginal buyer is waiting on Washington and capex guidance, not on another beat.
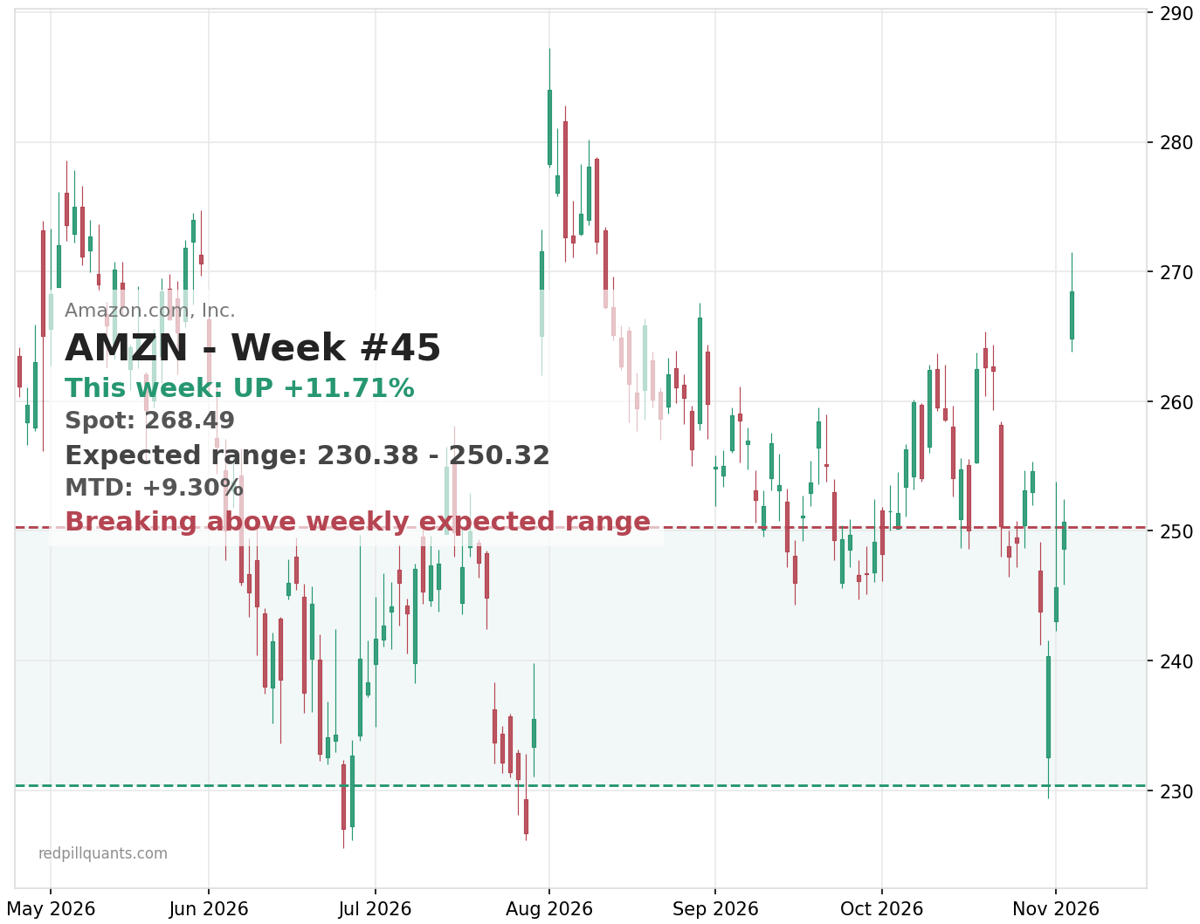 Meanwhile the money isn’t leaving tech, it’s changing seats. AMZN jumped about 7% on Tuesday and is up nearly 12% this week, now trading above the upper rail of its weekly expected move near $250. The market is paying for the companies that own the compute and discounting the ones that sell the chips.
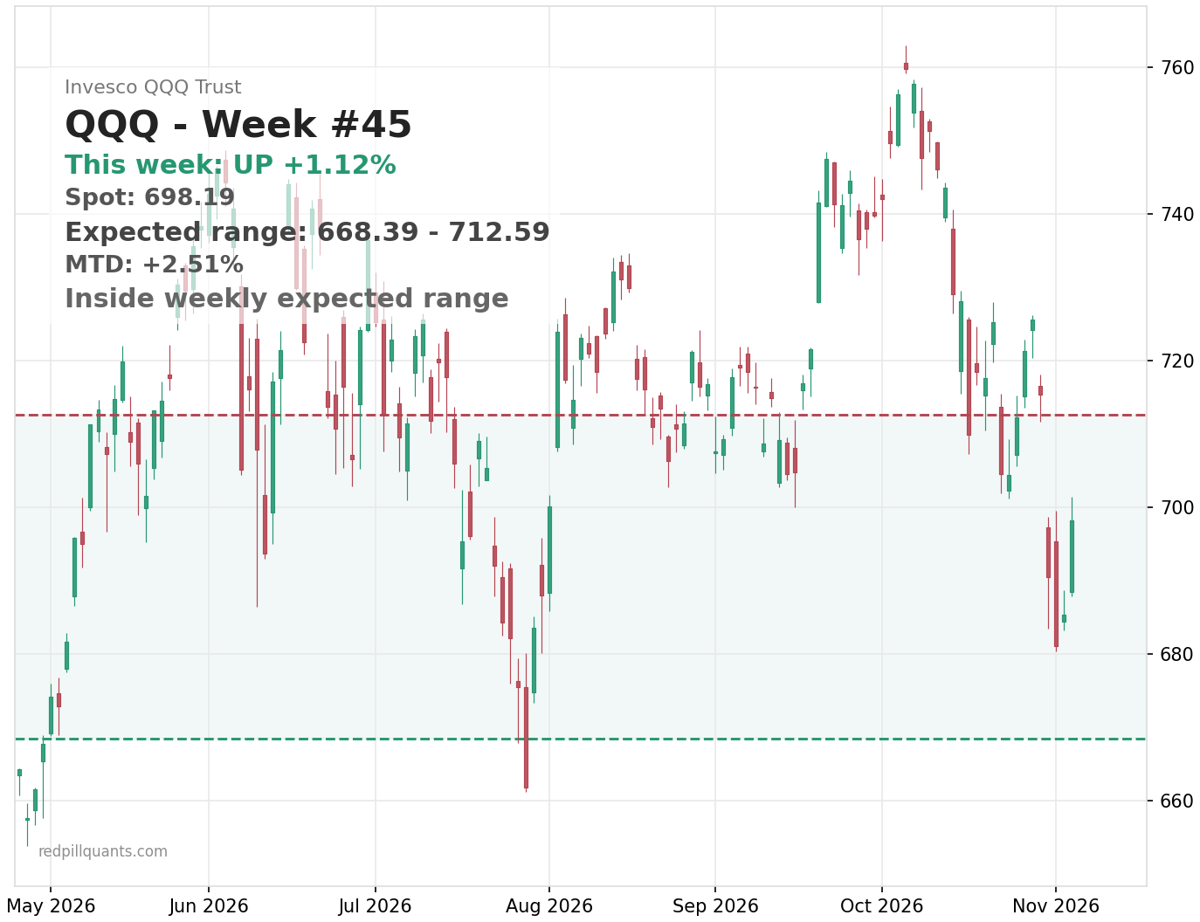 QQQ is trying to repair the damage, up nearly 2% on Tuesday with the short-term tape firm and price sitting inside a narrow weekly range around $668 to $713. But the trend structure still reads rollover. A firm week inside a downtrend is a repair attempt, not an all-clear.
My systems are treating this the way you’d hope. SigmaScanner is running a bull put on NVDA. It’s the weekly stock-options spread engine we call Payday Friday, and that structure is a defined-risk bet that NVDA holds its level, a very different wager than buying shares because the multiple looks cheap.
Blitzen closed its MSFT call spread at target this week for about +134% on the spread. It’s the weekly debit-spread engine that starts with weekly stats and then checks whether the spread still fits the tape, and it’s now holding a COST position. No RPQ system is positioned in AMD.
Here’s the filter I’d take from this tape. When a stock can’t rally on its best quarter ever, price is being set by something bigger than the company: capex cycles, politics, positioning. Buying that dip because “the fundamentals are great” confuses the quality of the business with the direction of the tape. I’ve made that trade. It costs the same every time.
What changes my mind: AMD reclaiming the 20-day average and holding it, or political clarity that takes the data-center overhang off the table. Until one of those shows up, strong earnings are a reason to respect the company, not a reason to catch the knife.
If you want this kind of read (trend state, expected move, structure fit) turned into actual entries and exits instead of homework, that’s what SPY Alpha does for equities and index options. check it out here
Cheers,
Michael