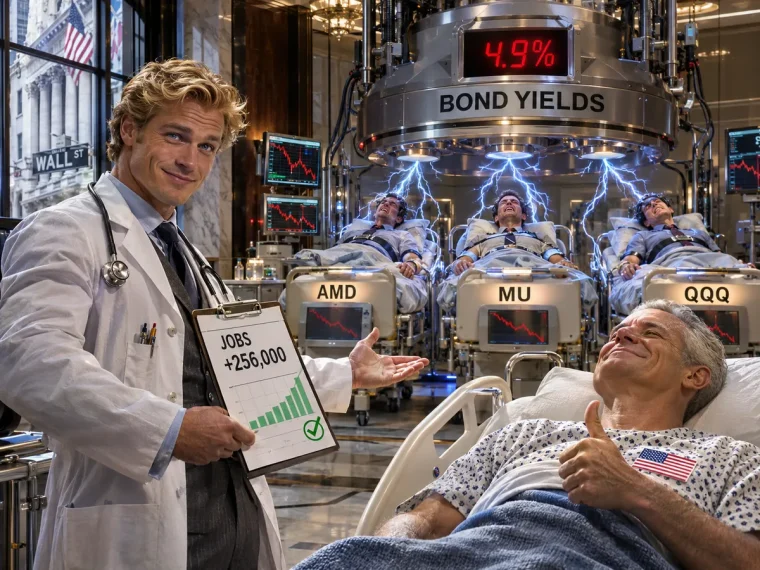




Micron’s bull case is a DRAM shortage that runs through 2031. Micron’s stock just closed the week near $690, about 16% below the bottom of the range options had priced for the week, near $824. One of those two clocks is setting the price right now, and it isn’t the 2031 one.
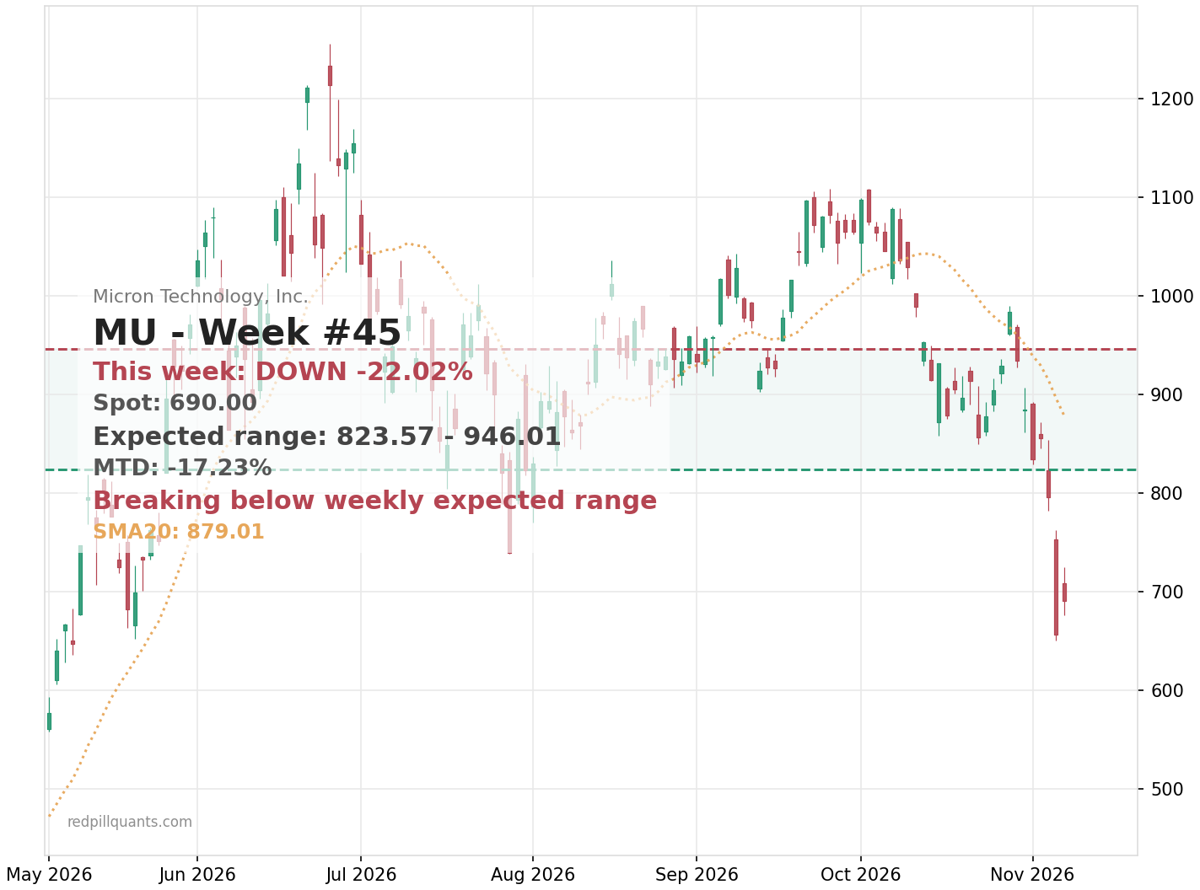
The weekly expected move is roughly a one-standard-deviation range, so finishing outside it happens roughly a third of the time. Finishing 16% outside it is a different animal. MU lost about 22% in five sessions and roughly a third over the past month, and even after Friday’s 5% bounce it sits about 21% below the orange 20-day SMA. That is not a stock testing a floor. It’s a stock still looking for one.
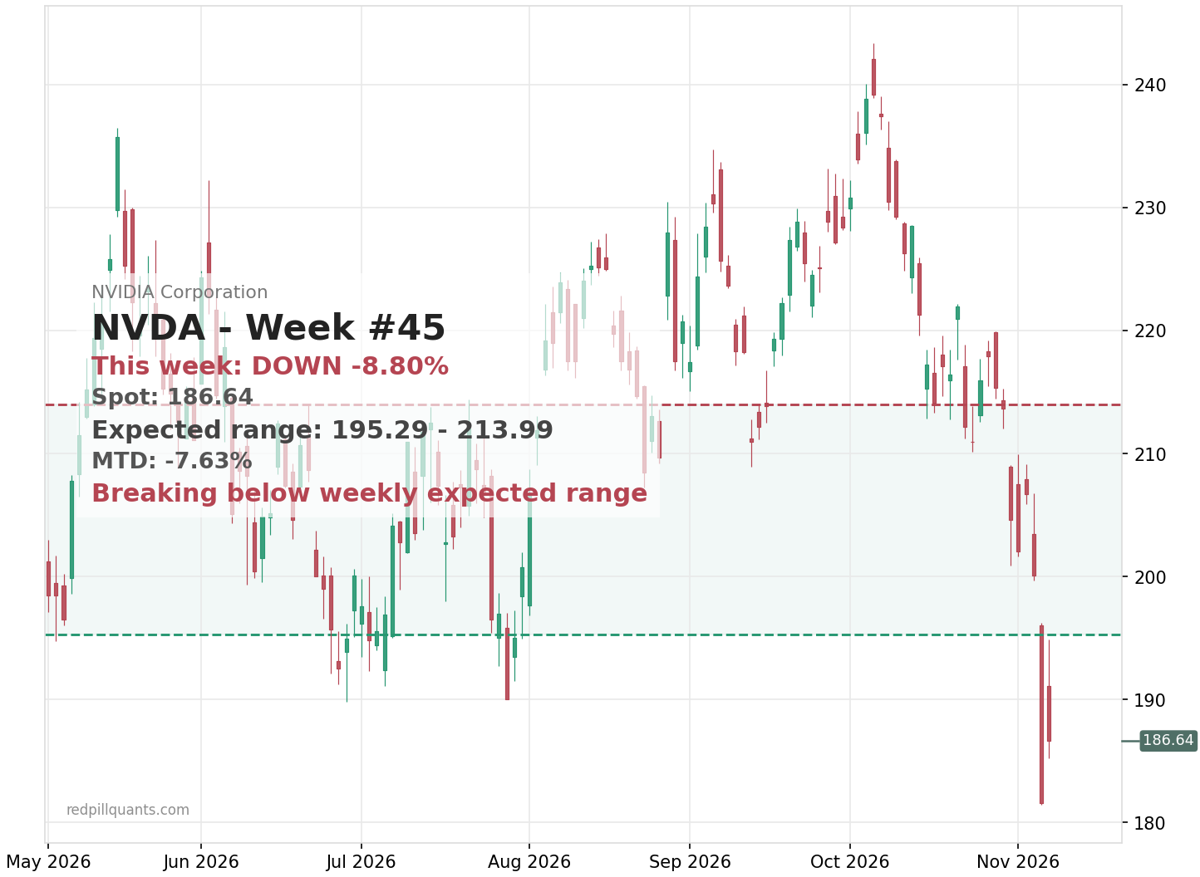
Nothing about this was Micron-specific. NVDA dropped about 17% on the month and closed near $187, below its own weekly priced floor around $195, sitting near three-month lows. When the leader of the entire AI trade is pressing the bottom of its range, the problem is the group, not the company.
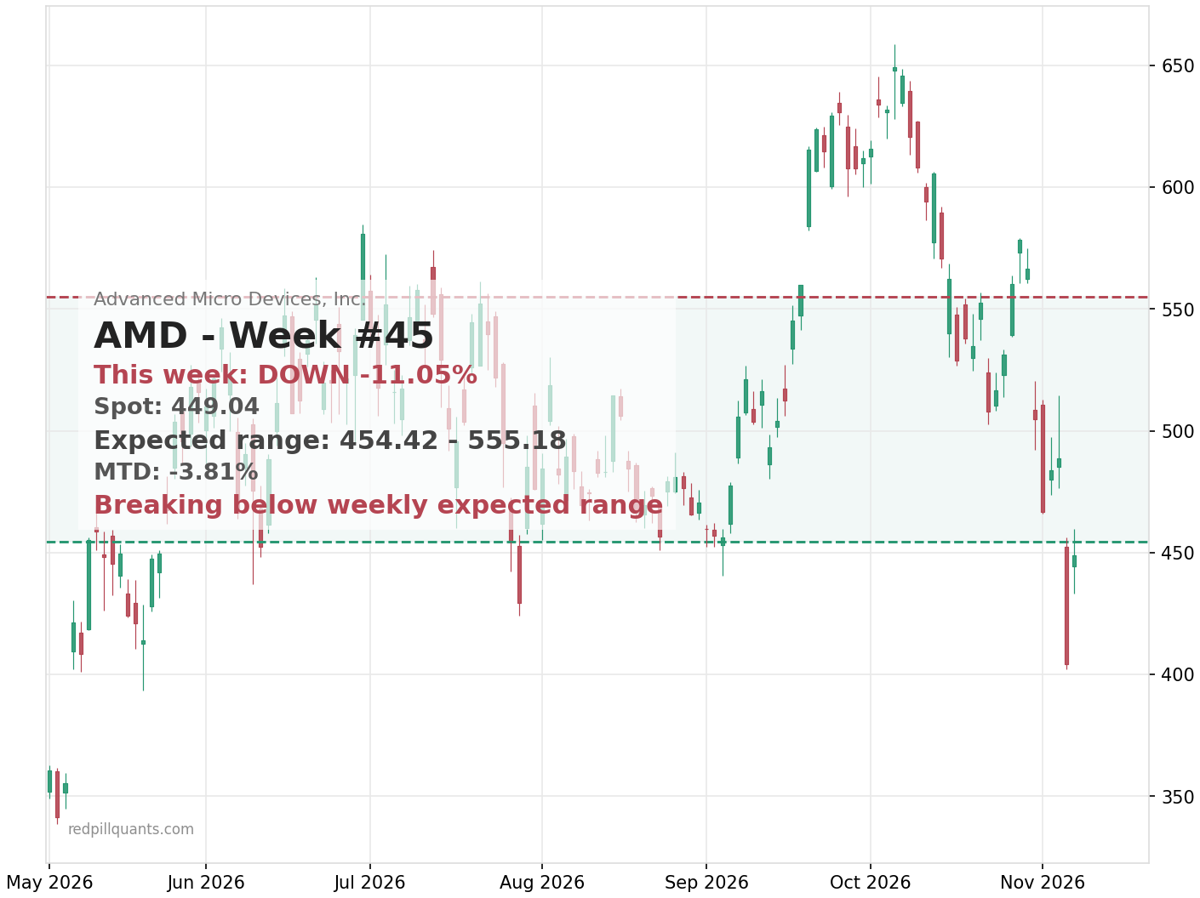
AMD makes the same point louder: down about 29% on the month, with Marvell off roughly 46% and Intel roughly 54%. AMD bounced 11% Friday and still closed below the bottom of its weekly expected move near $454. A double-digit up day that doesn’t get you back inside the priced range tells you how far the damage goes.
Why Now?
The reported drivers are a pile-up rather than a single cause: regulatory and permitting risk around AI data center buildouts after the change in congressional control, Nomura flagging year-end profit-taking in crowded 2026 winners, and Vanda tracking record retail selling. Then Friday’s strong jobs report pushed the 10-year to about 4.88%, which raises the discount rate on exactly the kind of long-duration growth story semis have become.
Against all that sits the bull case. Citi’s memory research from mid-September projects DRAM demand growth around 30% in 2027 and 35% in 2028, against supply growth of about 19% and 22%, with the shortage persisting through 2031. That may prove right. It is also a forecast about a multi-year cycle, and the market is repricing the group on a much shorter clock.
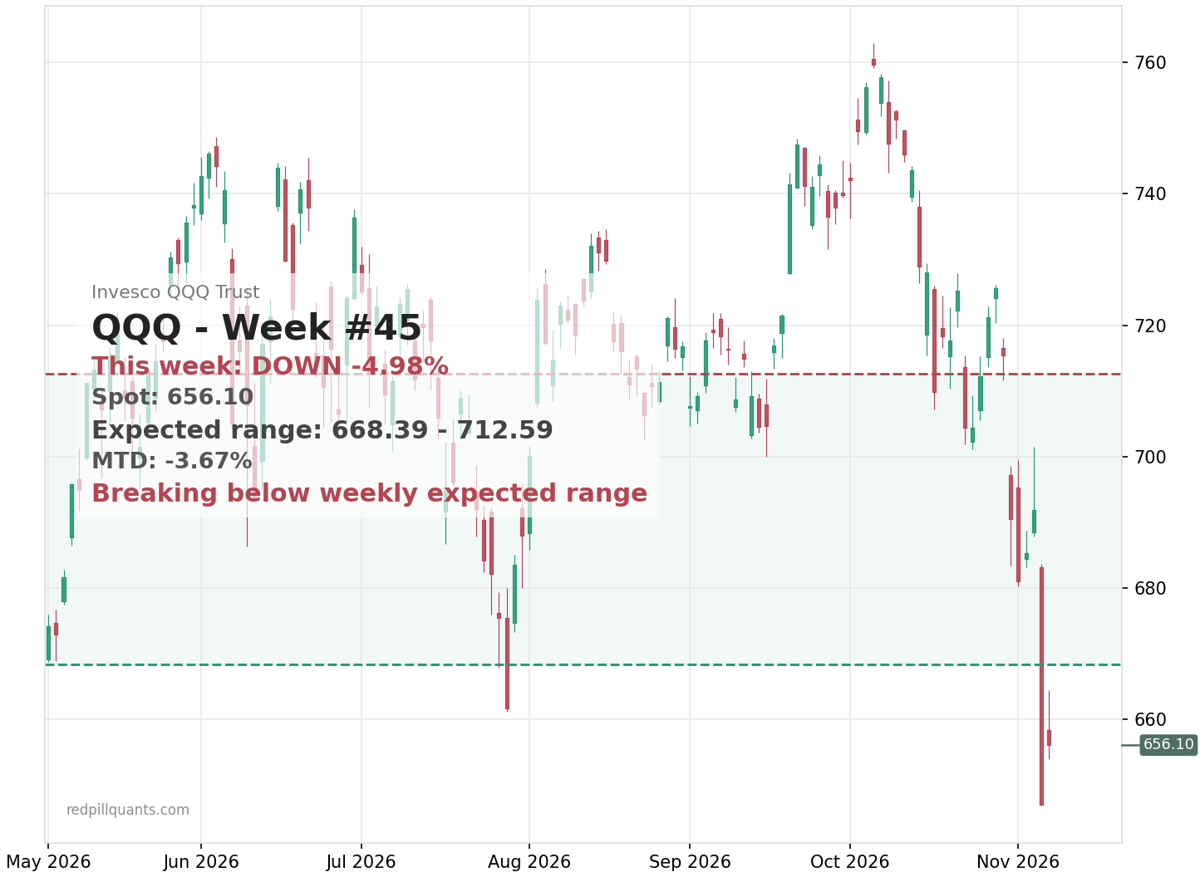
The index tells the same story. QQQ lost about 5% on the week and closed near $656, below its weekly priced floor around $668. VIX sits at a whopping 25.63 even after dropping 9% Friday. One piddly green session doesn’t change a risk-off tape.
So is MU overshooting or being repriced? Nobody knows, and anyone who tells you otherwise is shooting from the hip. An ambivalent DRAM forecast about 2028 certainly isn’t going to answer it.
Here’s what I do know. A stock 21% below its 20-day and 16% under its priced floor is a falling knife until it reclaims a level, and for MU that level is $824. Back above it and holding, the shortage story starts to matter. Until then, buying the story means buying someone else’s exit.
Waiting for the reclaim can cost you the first 10% of a recovery. It can also save you from the next 20% of a decline. I’ve been on on both sides of that trade, and the results are in: you might get lucky but over time waiting is much cheaper and retains your sanity.
If you want this kind of read (expected move, trend state, structure) turned into actual entries and exits instead of homework, that’s what the Alpha streams are for. SPY Alpha covers equities and index options. check it out here.
Cheers,
Michael