



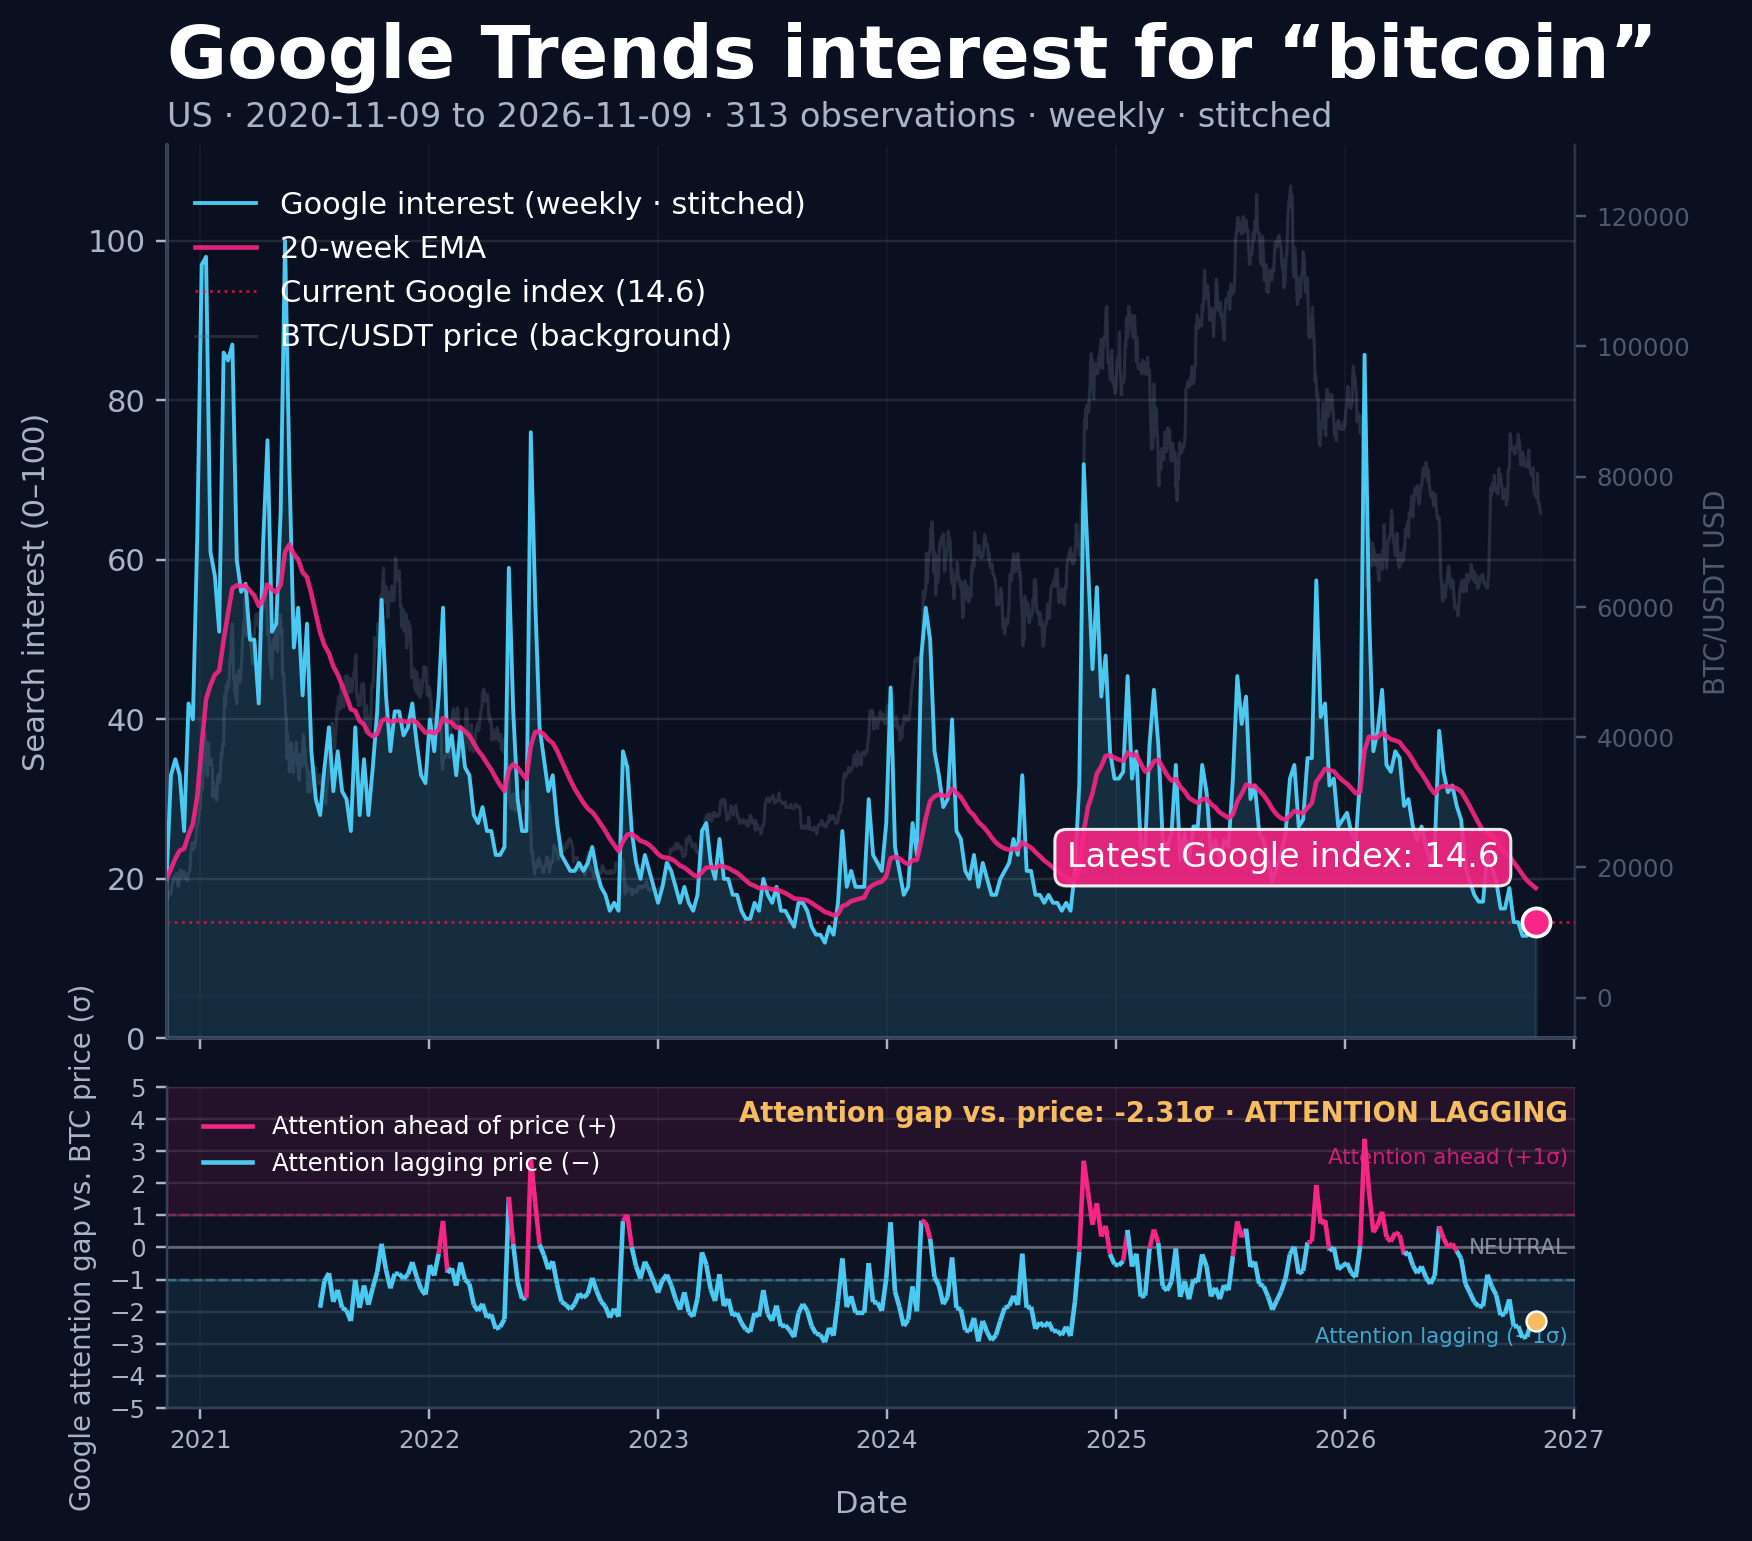
I’ve been tracking Google search interest in bitcoin against BTC price for years now. Given what we know about retail behavior, the picture isn’t exactly shocking, but it’s useful to see it laid out over six years.
A quick guide to the chart. The top panel is weekly US search interest for “bitcoin,” with BTC price in the background. Google only hands out weekly data in limited windows, so I stitch overlapping windows together to keep six years comparable. The bottom panel is the gap between attention and price, measured in standard deviations. Above zero, attention is running ahead of price. Below zero, it’s lagging.
Retail shows up late
Retail interest only materializes after big moves, up or down, and then drops off as soon as price goes sideways. Nobody googles a range.
Attention lags price
The gap spends over 80% of its time below zero. In plain English: by the time the public notices, the move has usually happened.
Crashes draw a crowd, briefly
Selloffs bring attention spikes, but they fade fast. It’s negative attention. People love rubbernecking at a car crash, but they don’t stick around.
The -3 zone
Around -3 standard deviations, a reversal becomes a reasonable expectation. That’s where most participants have walked away in disgust, the classic contrarian setup. But it’s not a timing tool. Those conditions can last for months while price builds a floor. We’re at -2.3 right now.
Takeaway
Retail interest is back near the 2023 lows. That’s not a buy signal by itself. What it does tell you is who’s been driving this market: the recent bull cycles were fueled by institutions and ETF flows, not retail. When the crowd eventually comes back, it’ll show up the way it always does, after the move.