


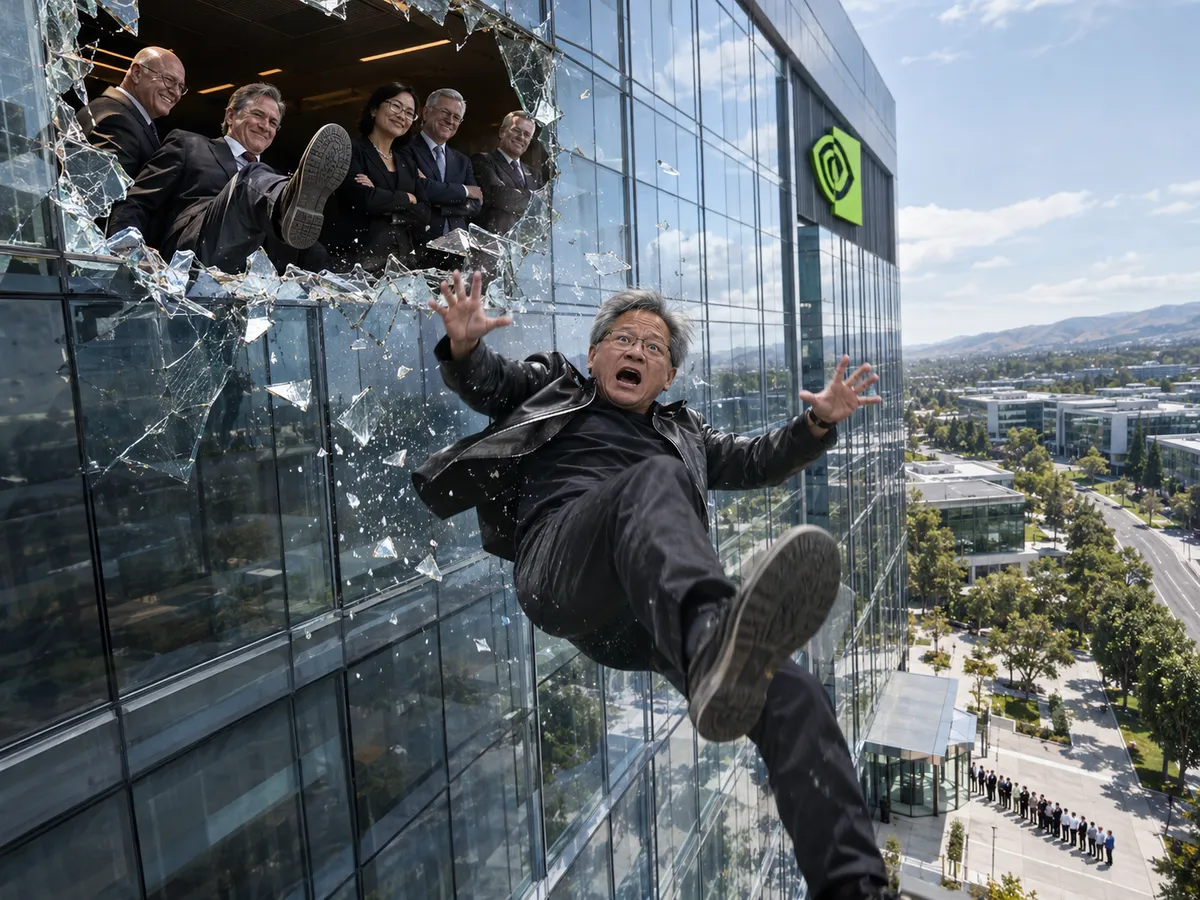
The founder of the company at the center of the AI trade is out, five days before earnings. Nvidia’s board announced this morning that Jensen Huang has resigned as president and CEO, effective immediately, after meeting Wednesday night. CFO Colette Kress steps in as interim CEO, and Tuesday’s earnings report is still on the calendar.
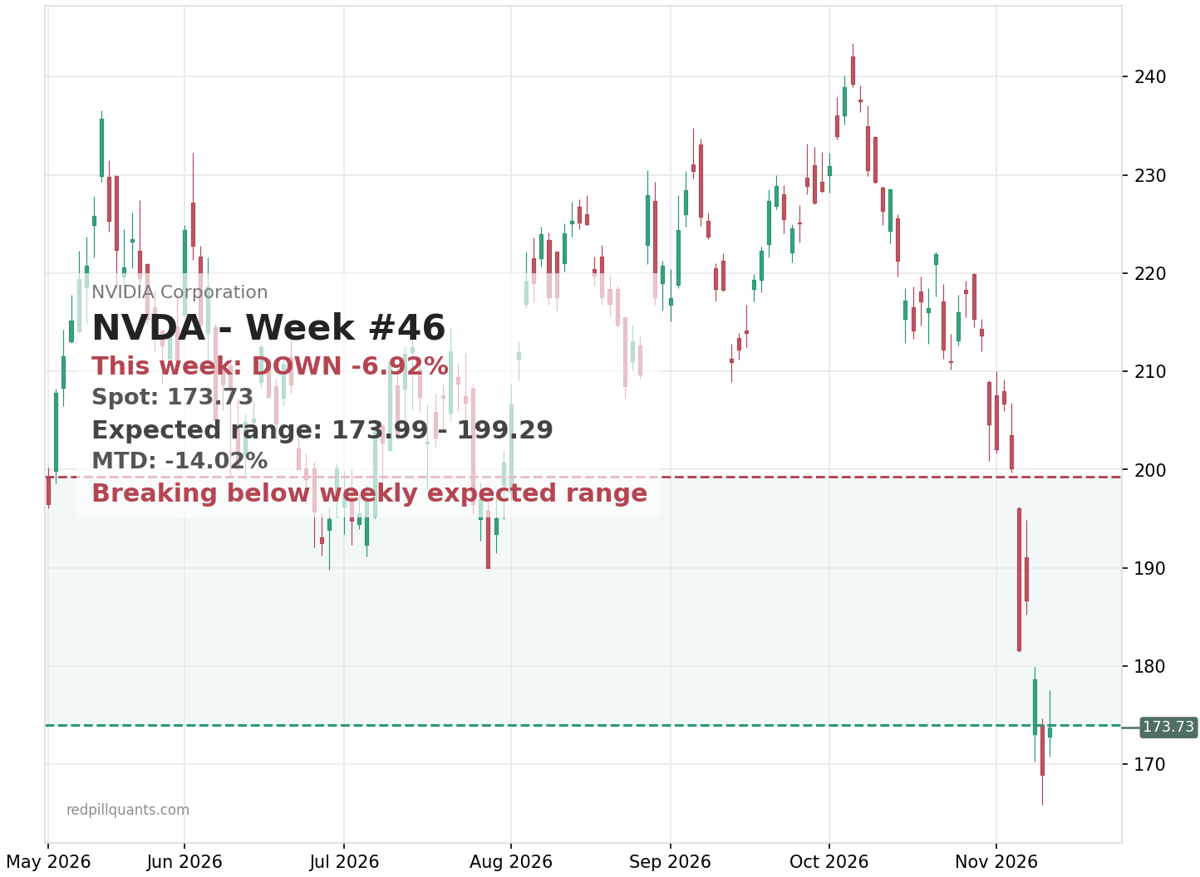
The overnight numbers are ugly. NVDA closed Wednesday up almost 3% near $174, then gave back roughly 7% after hours and traded around $162 this morning, with an overnight low near $156. Bernstein didn’t just downgrade, it cut its target from $400 to $200. Raymond James kept its buy. Earnings land Tuesday.
Zoom out and the headline is landing on an already damaged chart. NVDA is down about 15% in two weeks and closed Wednesday just below the lower rail of its weekly expected move. Premarket pricing near $162 is well through that rail. This is event risk stacked on a broken trend, not a healthy stock having a bad day.
Now the part the headline misses. While NVDA was under pressure on Wednesday, AMD rallied 7.3%, AVGO added 4%, and the Nasdaq-100 rose 2.3%. Money didn’t leave the semiconductor complex. It moved across the street.
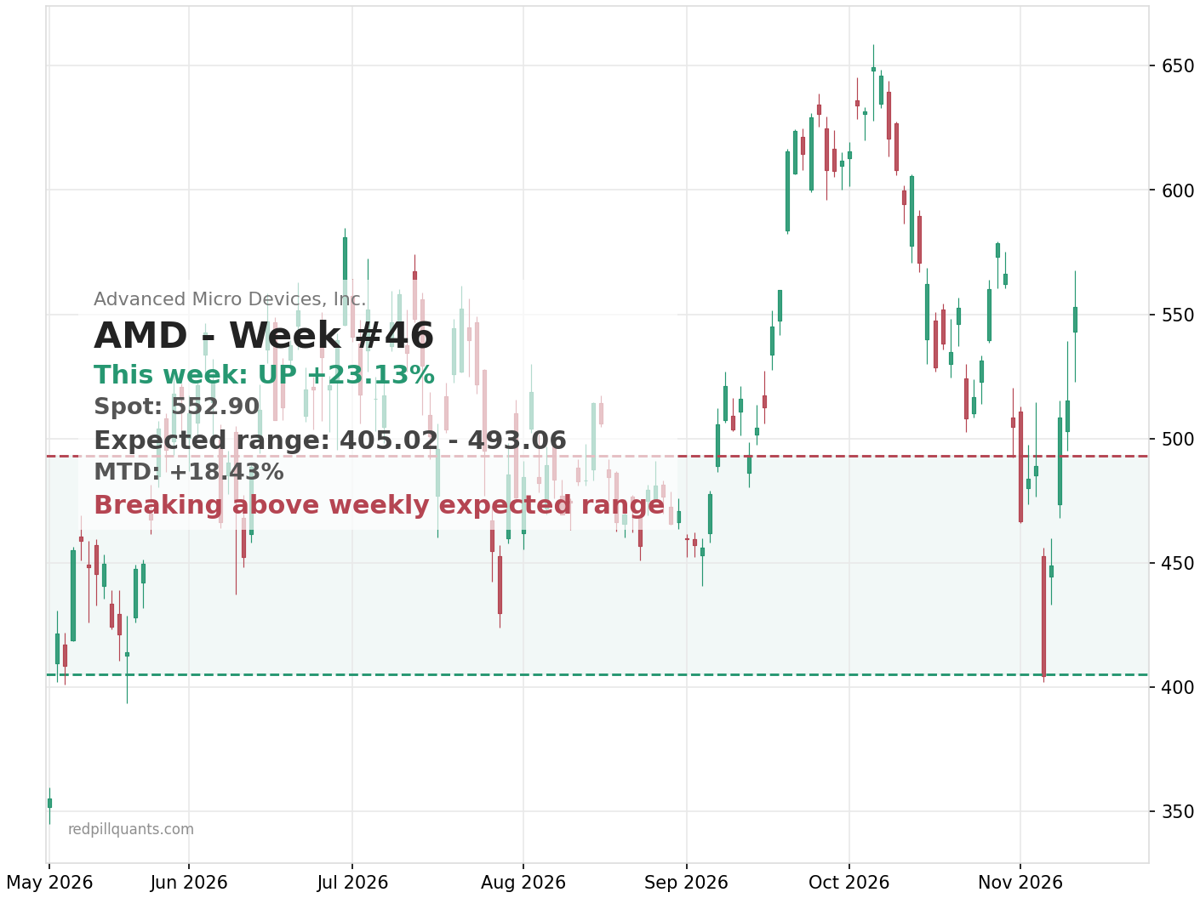
AMD is now well above the upper rail of a wide weekly expected move. Options were already pricing a nearly 10% weekly range, and price blew past it. AVGO is doing the same against its own range. That’s what rotation looks like in the tape: the sector holds while the leader takes the hit.
Here’s the number that matters more than any headline. During last Thursday’s roughly 4% drop in the S&P, Cboe’s one-month implied correlation gauge, a measure of how much stocks are expected to move together, reached only about 22%. In selloffs that size over the past 20 years, it has averaged closer to 70%. Cboe’s read: the options market is pricing a rotation, not contagion. And the NVDA board story broke over the weekend, after that selloff, so it didn’t cause the stress. Last night’s reports are an escalation, not the origin.
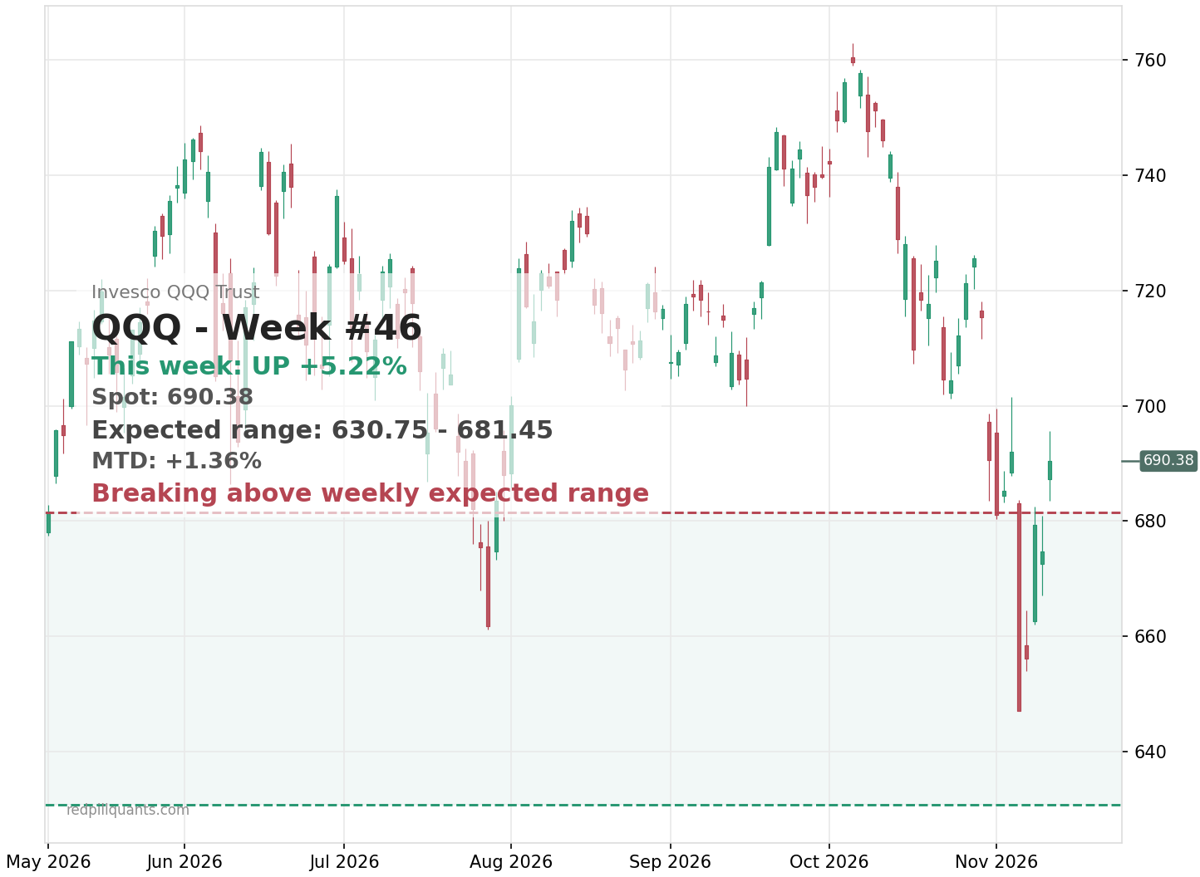
Why care about a correlation statistic? Because index volatility stays contained as long as single stocks offset each other: one name’s loss is another name’s gain. QQQ is pressing above the upper rail of a narrow weekly expected move while still sitting in a damaged downtrend. That arrangement works until the day the names start falling together, and then the index reprices all at once instead of piece by piece.
So the practical read into Tuesday: treat NVDA as event risk, not a referendum on AI. Watch AMD and AVGO. If they hold their relative strength, the rotation story is intact. If they start falling with NVDA, the answer isn’t a cleverer rotation. It’s less exposure.
On our side, the systems did what they do. Payday Friday banked 72% of the entry credit on GS and 61% on EXPE. That’s the weekly credit-spread engine doing its boring job.
If you want this kind of read turned into live equity and options signals instead of a morning essay, SPY Alpha covers equities and index options. Check it out here.
Cheers,
Michael