




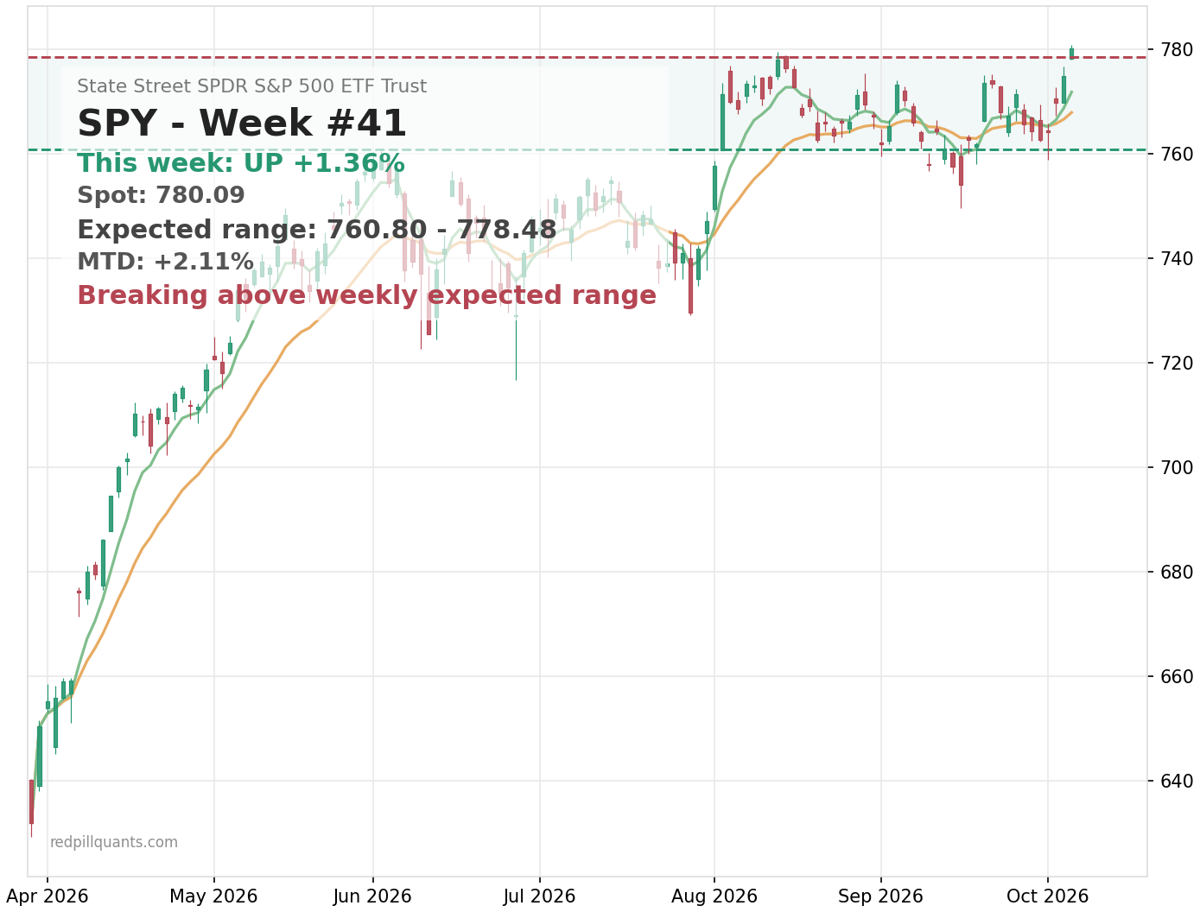
The S&P printed a fresh all-time high at 7,817 on Monday. SPY closed at 779.64, which is above the top of its own weekly expected move, a range that was pricing about 1.15% of travel for the entire week.
The market’s immediate response to that new high was to buy insurance like the building’s on fire. The put/call ratio in SPX options making the rounds this morning is 2.77. Nearly three puts trading for every call. That’s elevated even by index standards, where put-heavy flow is the norm.
That number is being passed around as a warning. I’d file it differently. Heavy hedging into a rising tape with falling volatility is not what tops are usually made of. It’s what squeezes are made of. Every one of those puts has a dealer on the other side, and that dealer’s hedging can turn into buy orders if price keeps drifting up.
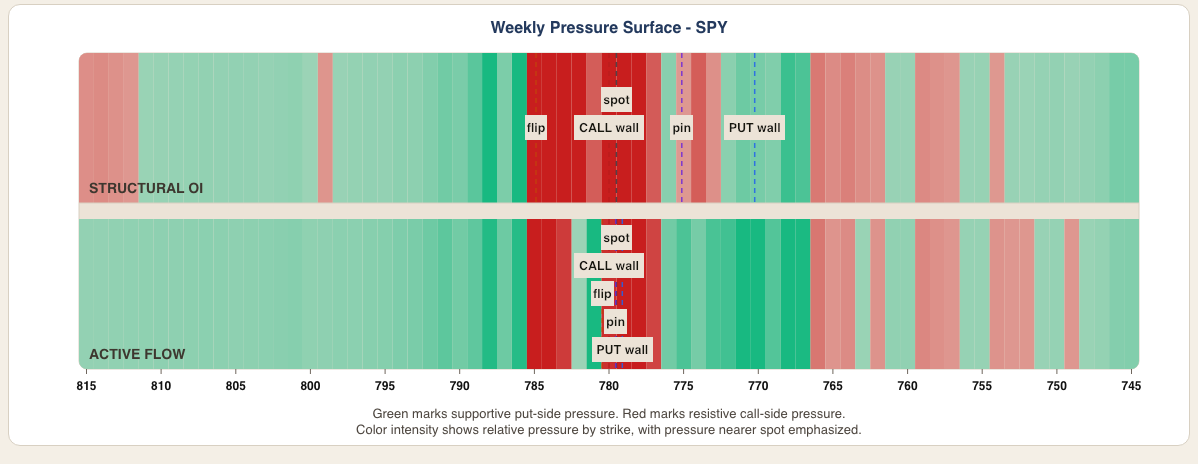
The structural picture says the same thing. Marketflow, my positioning read on where the open-interest walls and air pockets sit, has SPY in a pinning regime with the big call wall at 780, basically on top of spot. Above that there’s a gamma vacuum: thin positioning, nothing structural to slow a push higher. Short-call risk is running 75 out of 100, which is the system’s polite way of saying that selling calls here is how you donate to the rally.
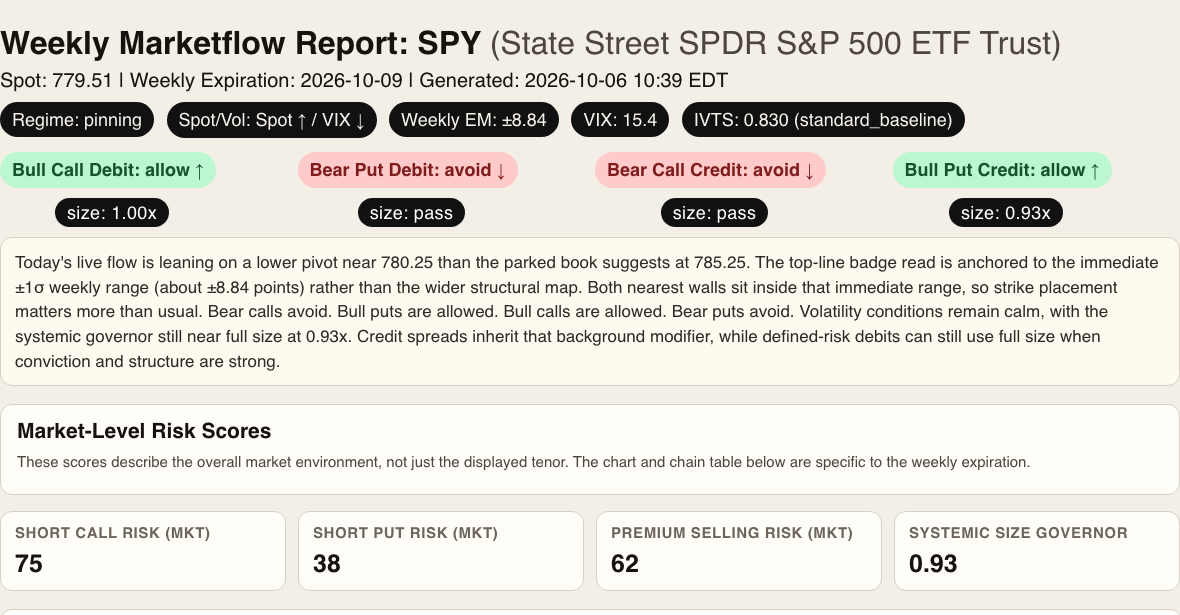
Here’s where the gamma structure tells the story visually:
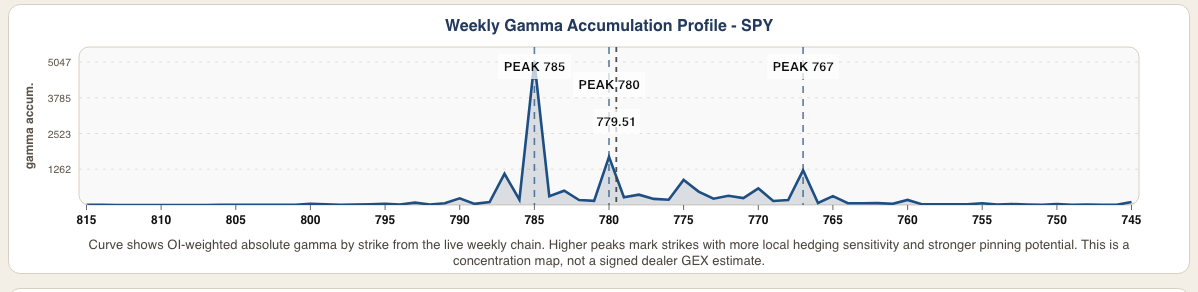
And the pressure read confirms it:
One historical note doing the rounds: similar breakout setups have supposedly averaged about +3.4% over the following 60 days. Fine as context, useless as a promise. Averages include every instance that failed, and the sample is never as large as the chart implies.
The 780 wall is the gate. Monday’s close landed a few cents under it at 779.64. Close, but not through. If price pushes above 780 and holds, there’s nothing structural above it to slow the move. If it doesn’t, the pin stays in control. A hold above 780 is the confirmation, and below 776 the read is wrong.
Chasing the breakout with size before 780 clears is one mistake. The mistake this tape really invites is the opposite: shorting the high because it feels extended, or selling call credit into a melt-up with a 2.77 put/call telling you everyone else already bought the insurance. Selling calls here means standing in front of the exact flow that could run you over.
The real leader right now is AMD, up 28% in 20 days and closing near 649 after another leg. The CEO is talking about expanding 2027 capacity, and the Street is raising price targets on AI-agent demand, which is touching, given the targets are chasing a stock that already left without them.
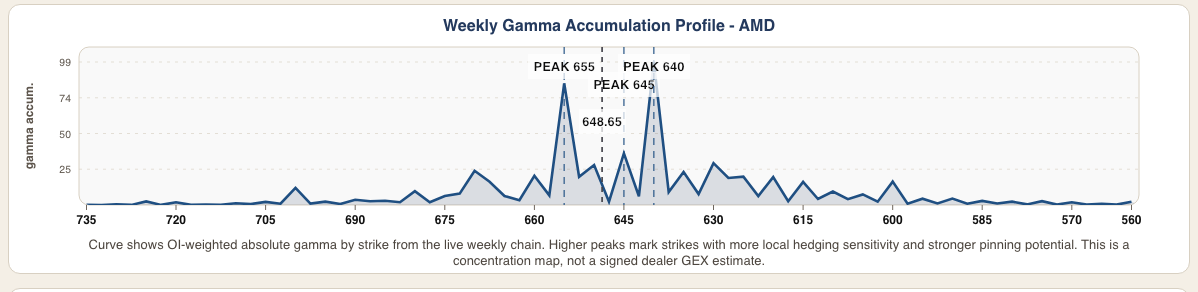
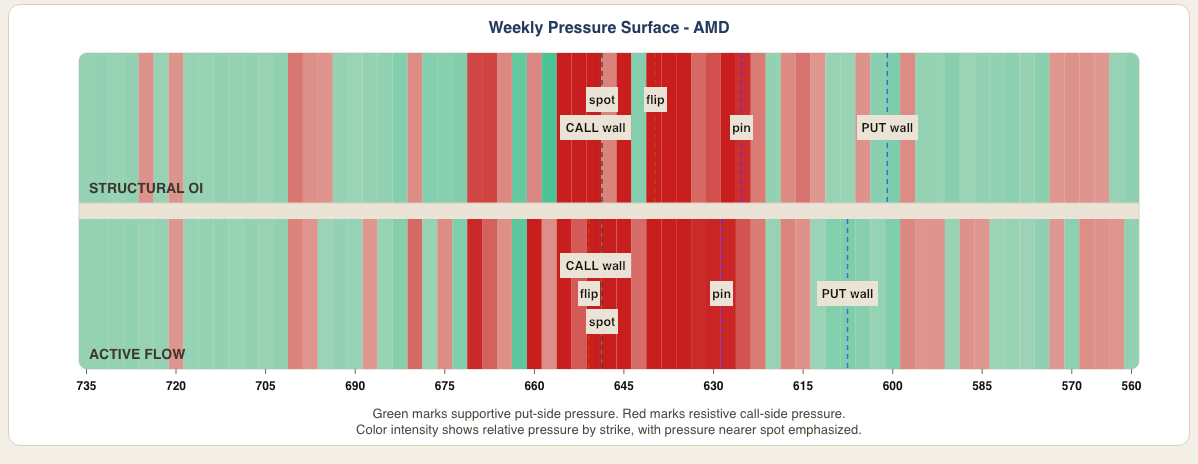
For once the narrative and the tape agree. But look at the structure: a call wall at 650 sitting a dollar overhead, and heavy fresh put positioning down at 630. Same story as SPY. The 650 level is the gate. If it clears, room above. If it doesn’t, the pin holds and the entry bleeds. The story can be right and the entry can still be bad.
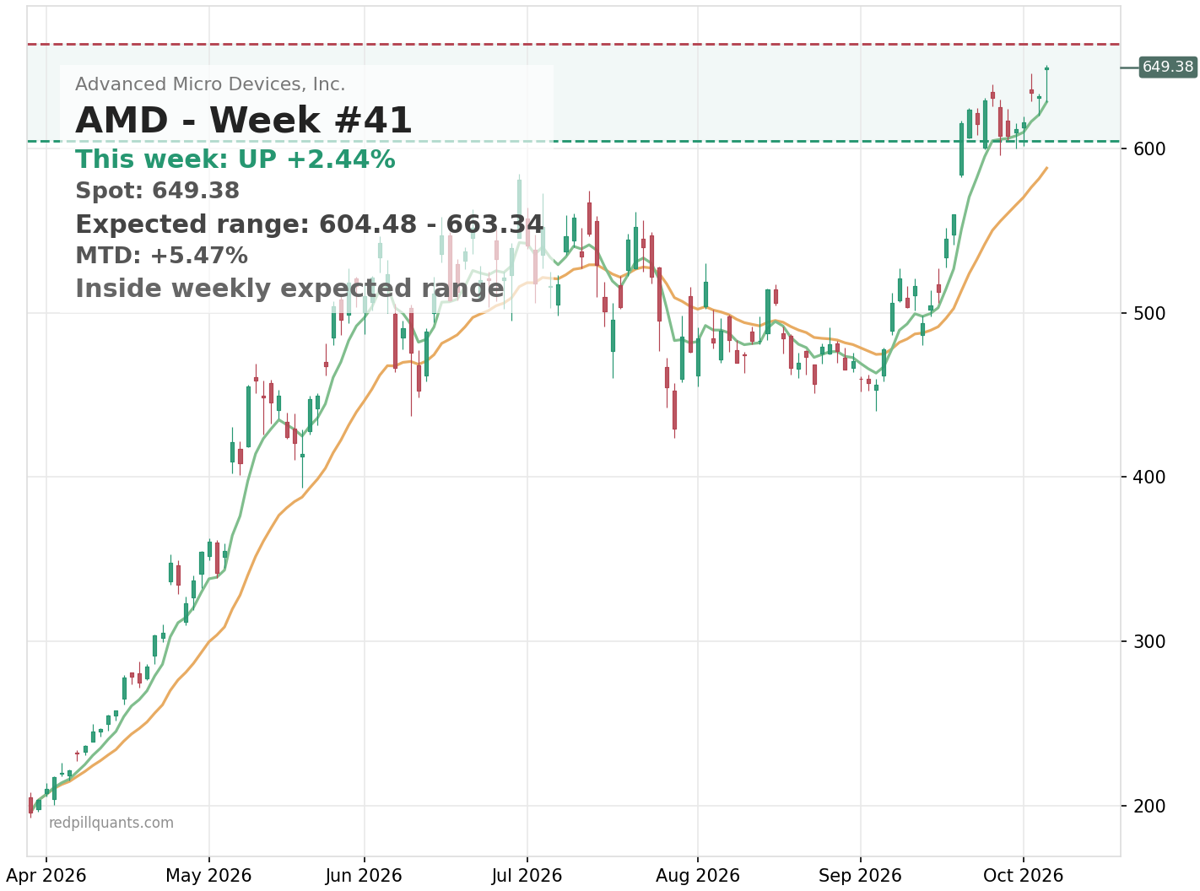
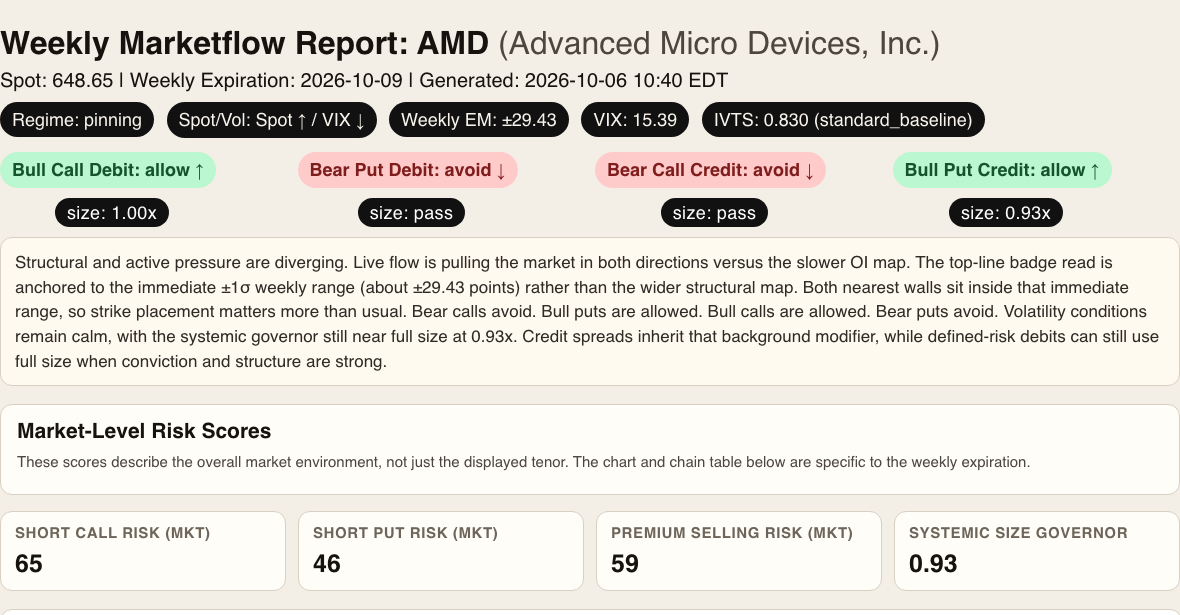
The gamma and pressure reads on AMD:
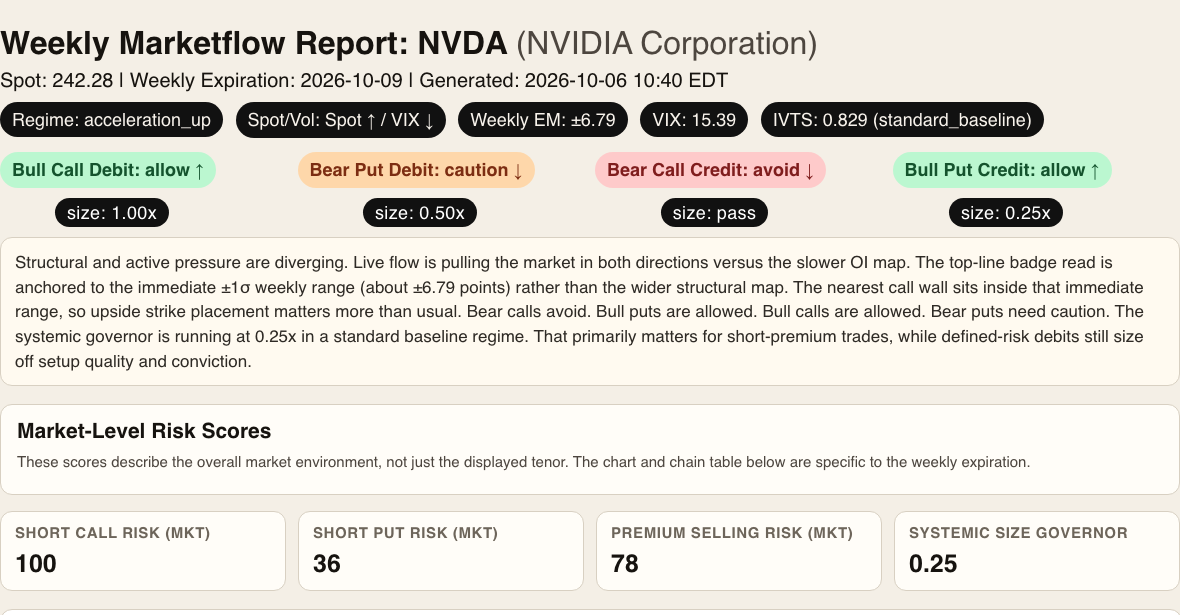
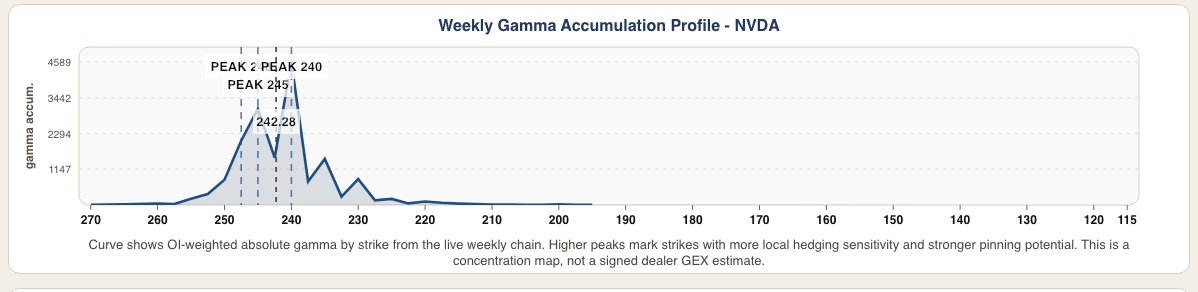
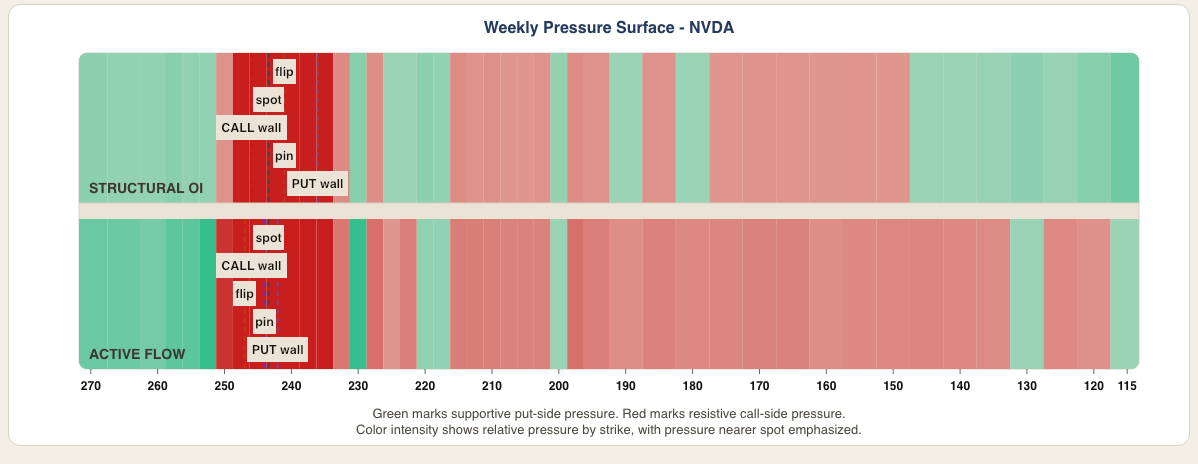
Then there’s NVDA, the one name already in an acceleration regime. Spot near 242, call wall at 245, a gamma vacuum above with active momentum behind it, and short-call risk pinned at 100, the maximum reading. If you want to see what “hedging becomes fuel” looks like in real time, that’s the chart.
What could go wrong? Pinning regimes exist to suppress exactly the move everyone is now positioned for. If the breakout stalls under 780, those hedges get monetized instead of squeezed, and the unwind is rarely gentle. VIX at 15.4 says nobody is being paid to be brave here. I’m not shorting this tape, and I’m not chasing it with size either. The edge is in knowing which mistake you’re not making.
Full marketflow reports if you want to dig into the levels yourself:
SPY levels and structure | AMD levels and structure | NVDA levels and structure
This is the kind of read SPY Alpha runs on. Trend state, positioning, expected move, and the spreads that fit them. If you want the signals behind the judgment, sign up here.
Cheers,
Michael