


Regime Change
Regime Change
It’s relatively quiet morning thus far which gives us time for another exercise in tape reading. This time we are going to take a more in depth look at equities and cover a few tell tale signs that tell us if and when the market has transitioned into another distinct phase. Let’s start with the Zero:
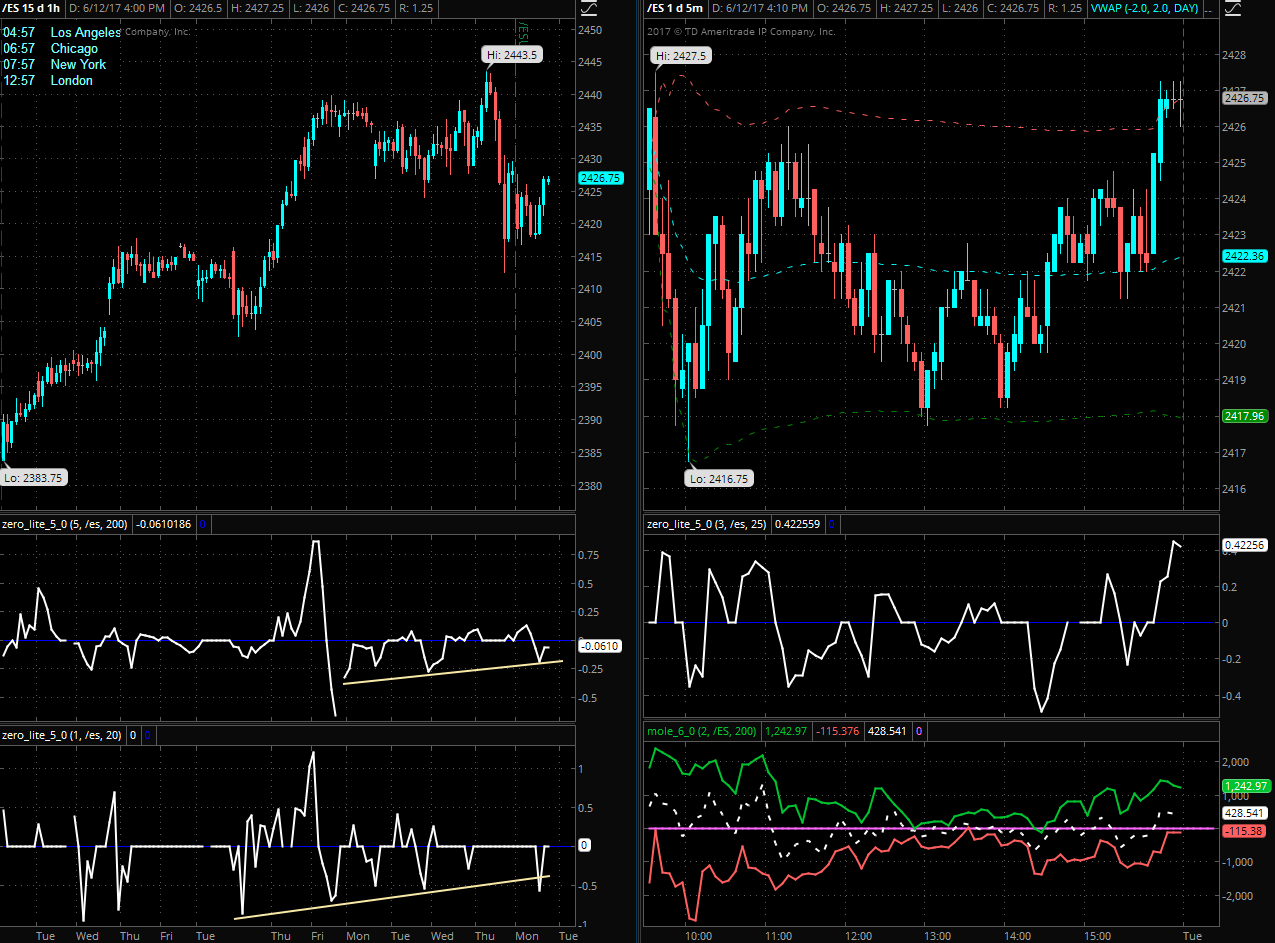
Forget about the signals for a moment and just focus on the price action, in particular on the hourly (left) panel. What do you see? I see a transition that began early this month and separates low volatility trending tape from high volatility sideways tape. Basically we went from an easy ride to ‘I am going to pull my hair out if it doesn’t pick a direction soon.’
But what characteristics define trending tape from a sideways churn? For one you’ll see either a uniform series of higher highs and higher lows or as in the latter phase in the center of the left chart an almost continuous series of just higher highs. Inversely of course you would see the same but toward the downside, e.g. lower highs and lower lows or a series of just lower lows. Spike highs and spike lows are distinct and relatively rare. Candle wick lengths are uniform and all within one standard deviation (if you would measure them). And finally the hourly Zero signal primarily points upward or during corrective periods is comparatively weak.
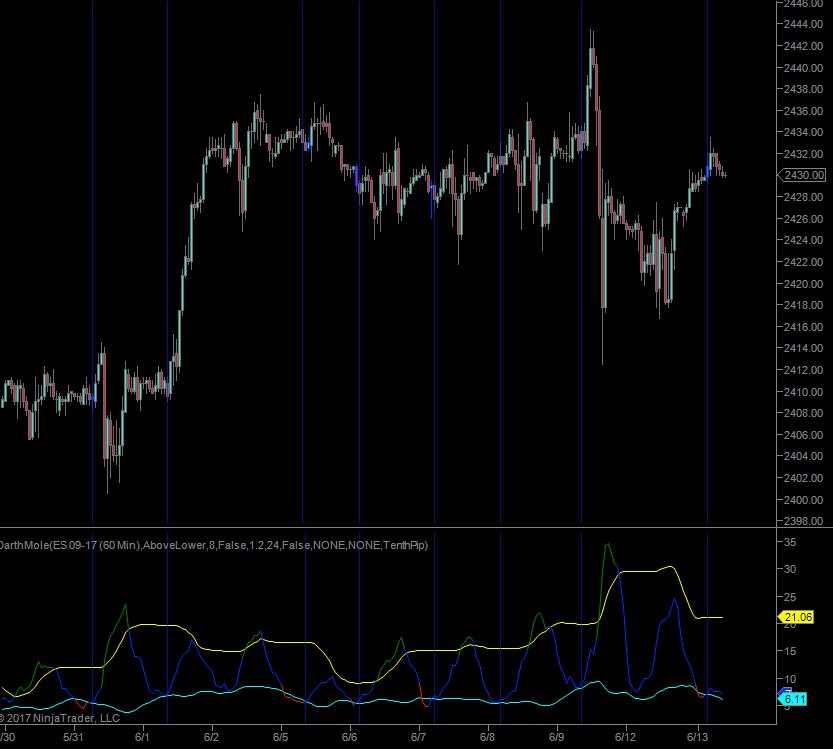
Compare that with the past two weeks of price action. Clearly volatility is on the increase as also evidenced on the expanding Bollinger in the volatility cycle panel above. There is a lot of overlapping price action with small short term trading ranges taking turn with fast candles in both directions featuring long wicks. This smells like accumulation or perhaps distribution. If it’s the latter then a final push higher is a possibility but it’s extremely difficult being long in such a market, so I would have to abstain until I see volatility die down a bit.

And then there’s the NQ which literally fell out of bed last Friday which must have triggered a boatload of stops and probably produced painful losses for anyone holding long positions. The daily panel looks like it may be a long candidate but after considering equities as a whole I cannot justify getting involved here right now.
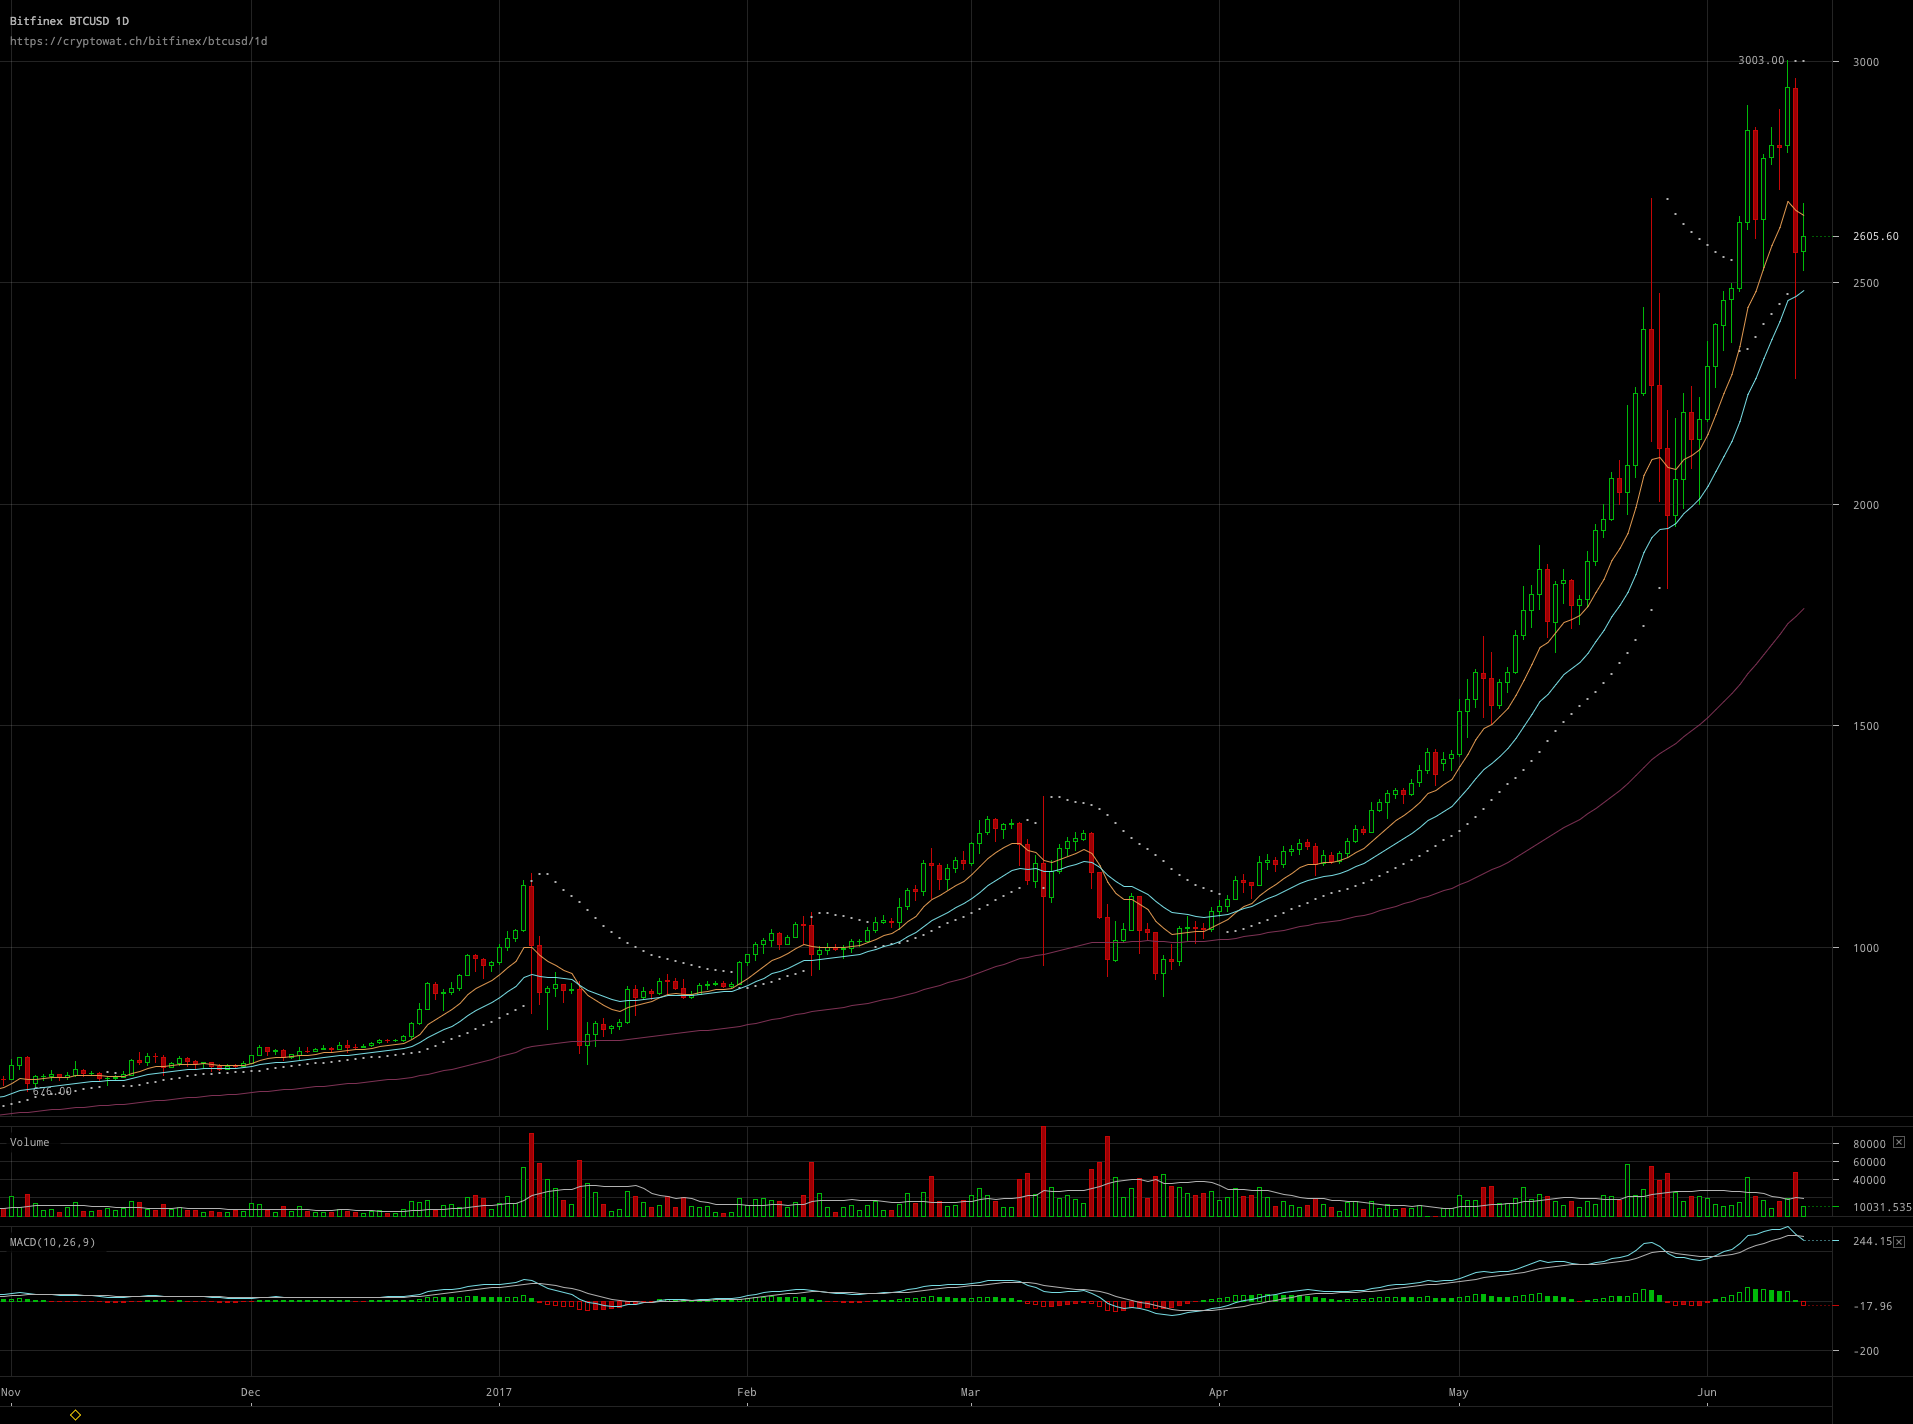
I’ve been following the exponential rise of Bitcoin with much interest lately and Chris over at the Spiral Calendar even managed to grab some long positions on ETH (Ethereum) during a major low. He mused that trading and charting crypto currencies has been a lot of fun for him as they seem to remain unaffected by central bank meddling. However the current market phase is looking clearly exponential and thus can only lead to a massive shake out in the near term future. If you are holding some then I hope you took at least partial profits when it touched the 3k mark.
Campaign Updates
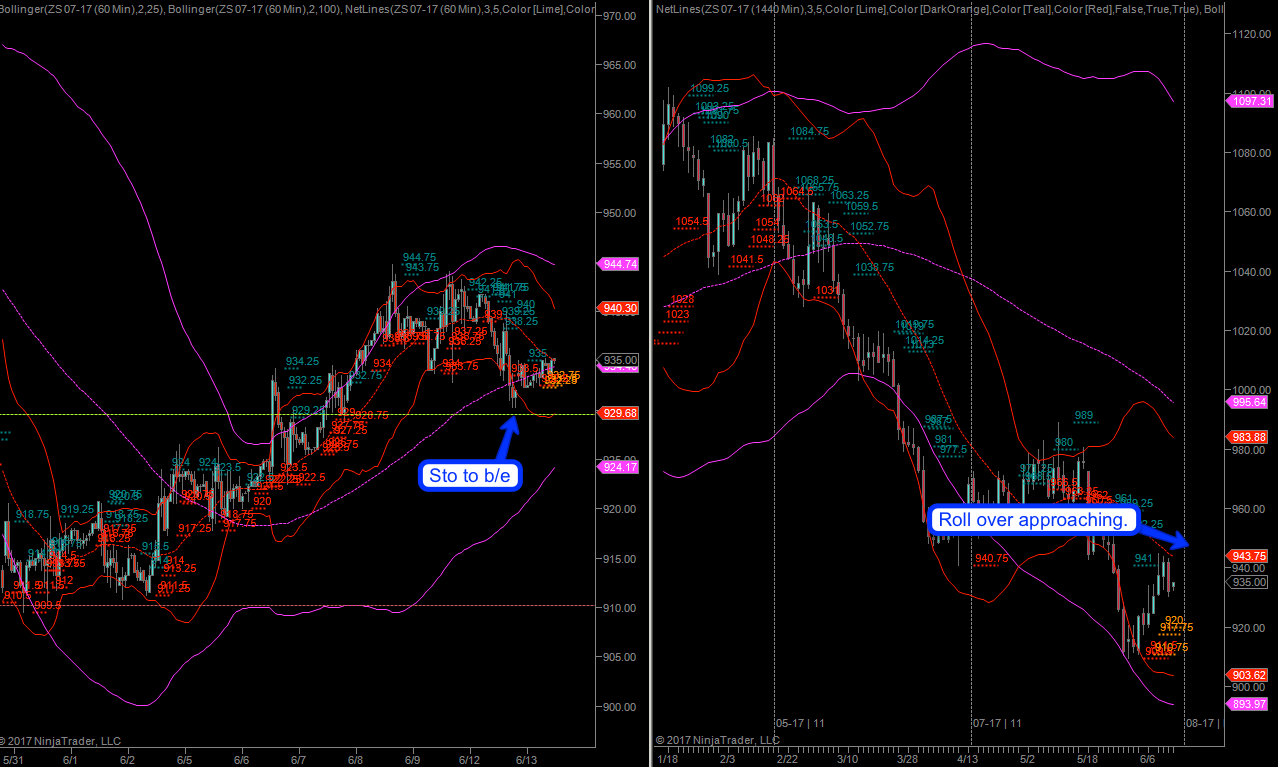
Soybeans is still in the running but I have now moved my stop to break even which also happens to be near the recent spike low. First up I’ve given this campaign a lot of time but what led me to reduce risk here is the approaching roll over which may be good for a few wild swings.
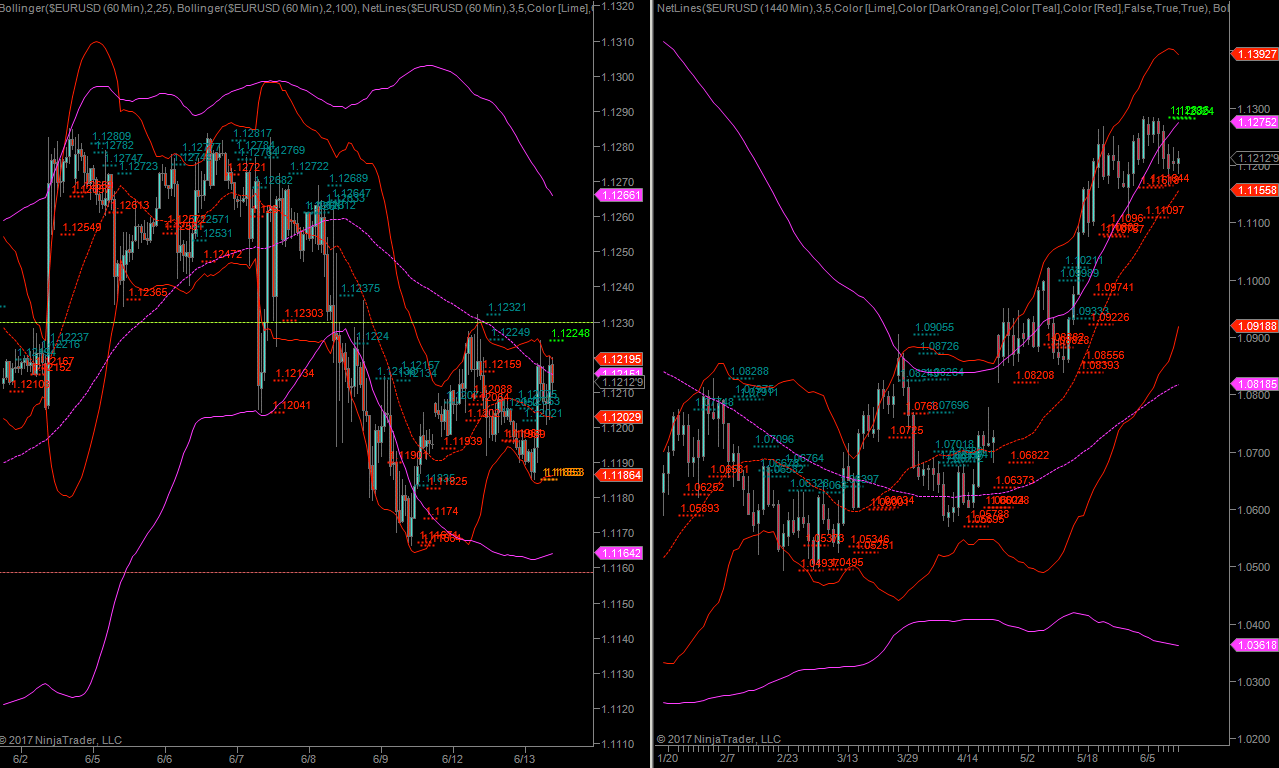
EUR/USD is also still in the race but it’s starting to look more and more like a possible short setup. Unless I see a more convincing short signal however I have to keep holding long here. No reason to get psyched out by a difficult market phase. Either trade or don’t trade, but let’s not start mocking with open campaigns willy nilly. The soybeans campaign is a rare exception due to the roll over.
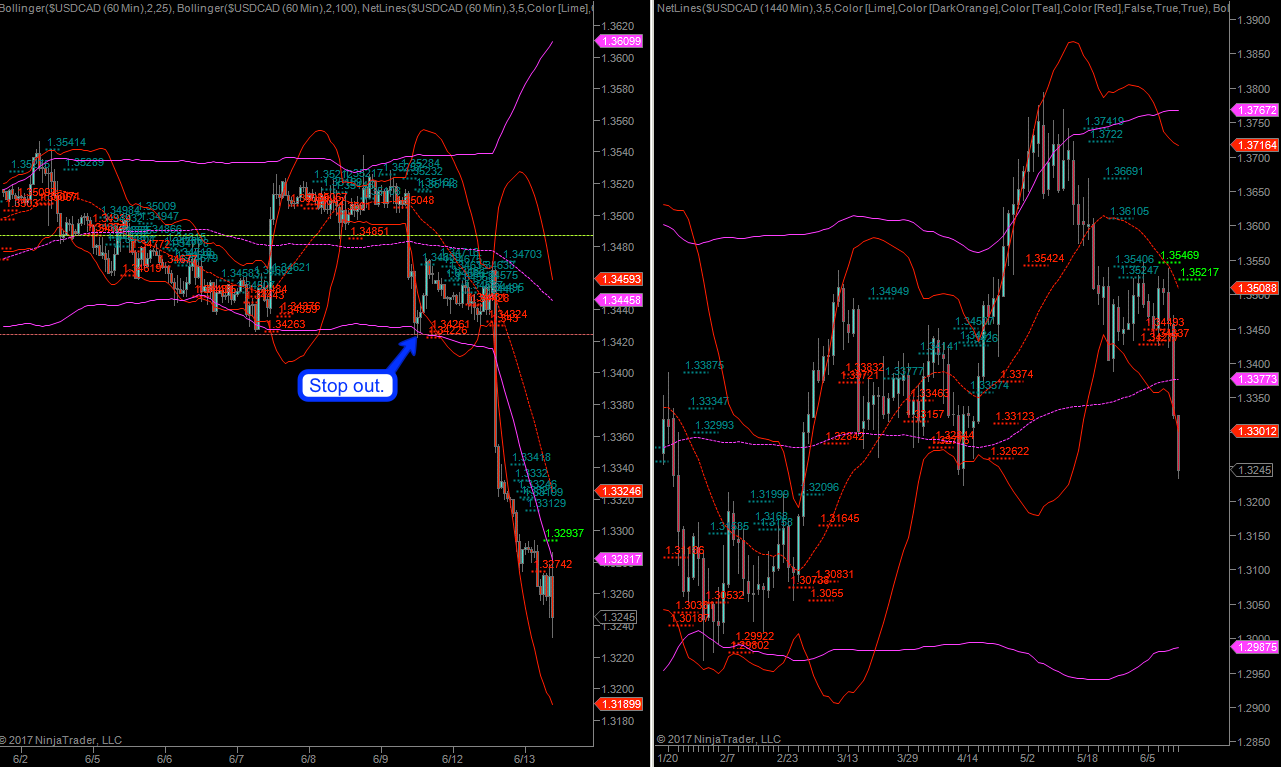
USD/CAD is a goner, which was a bit surprising given prior context but it seems the Dollar is going where I recently suggested it would probably settle near long term support.
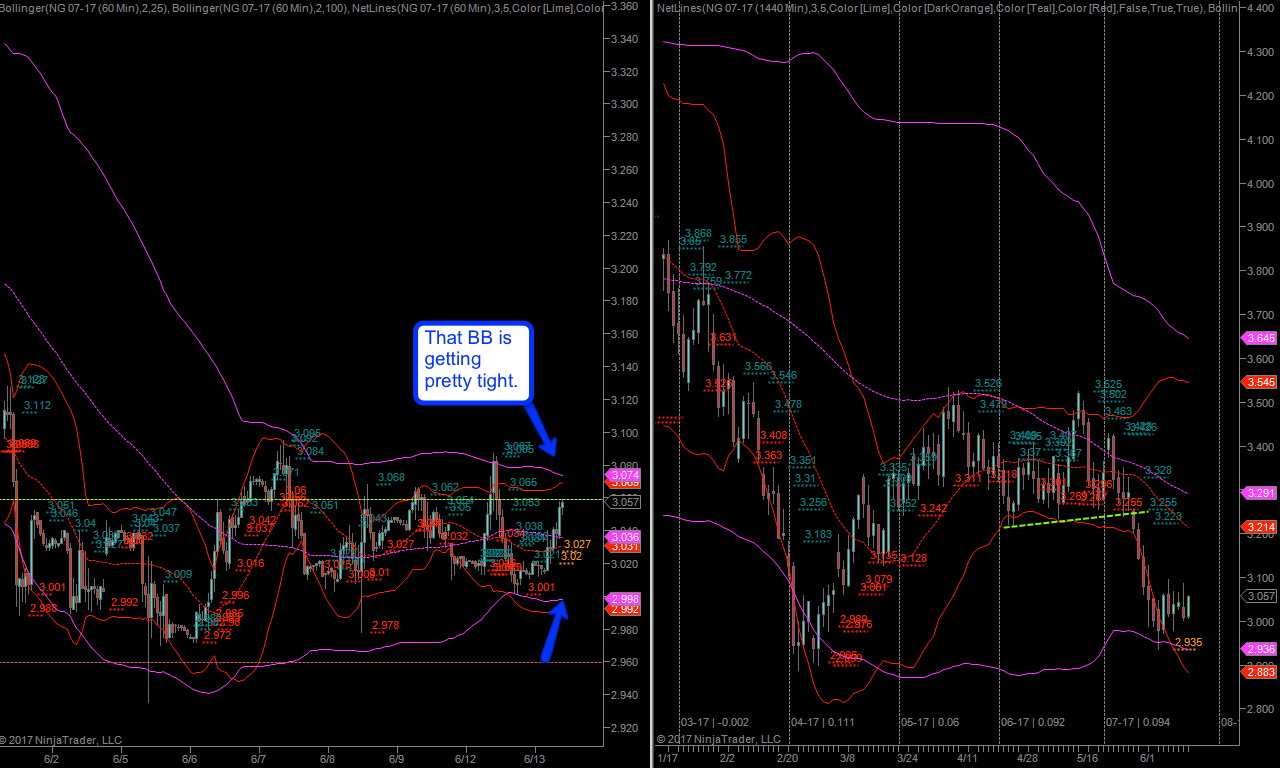
Natgas almost back to break/even and it gave us/me a bit of a scare in between.
Regime Change
So in summary I am seeing a marked increase in realized volatility all across the board which qualifies as a bona fide regime change. We’re seeing it in equities, across currencies and even in cryptos, in commodities, in the bonds. What’s worse is that it’s bi-directional RV and that makes trading extremely difficult for us as we now need to adjust our entry approaches and in particular our campaign management. My suggestion for now is to head to the beach and enjoy some early summer days until we see conditions revert to something more directional.


